Analytics
Cloud-Based Data Analysis Platform
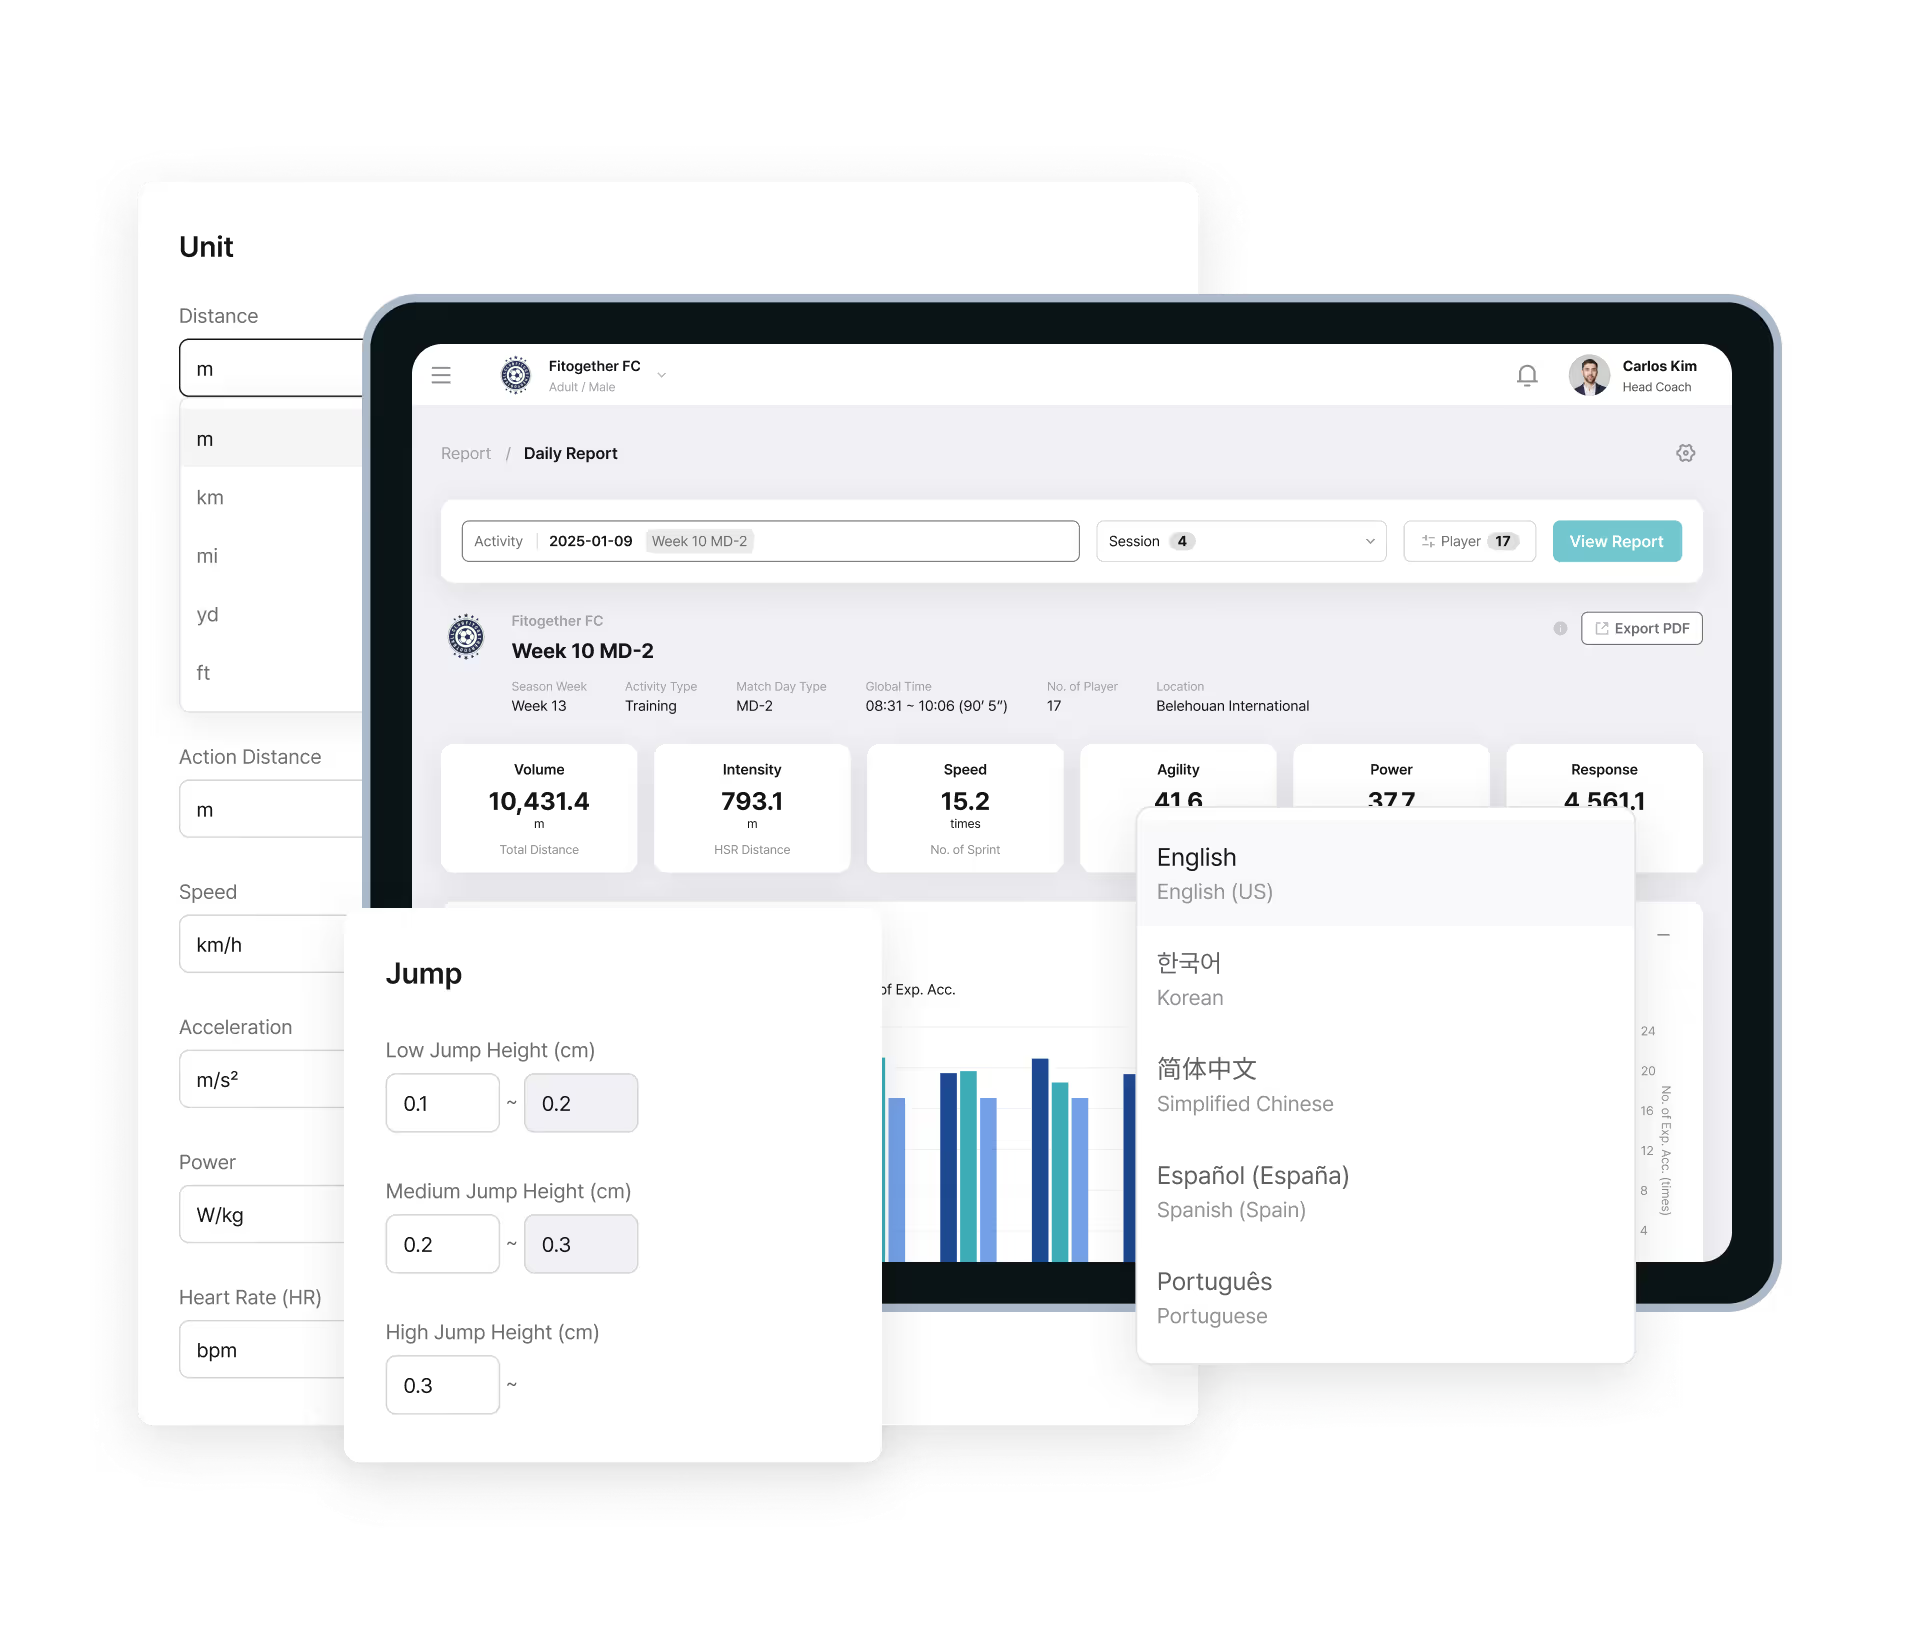
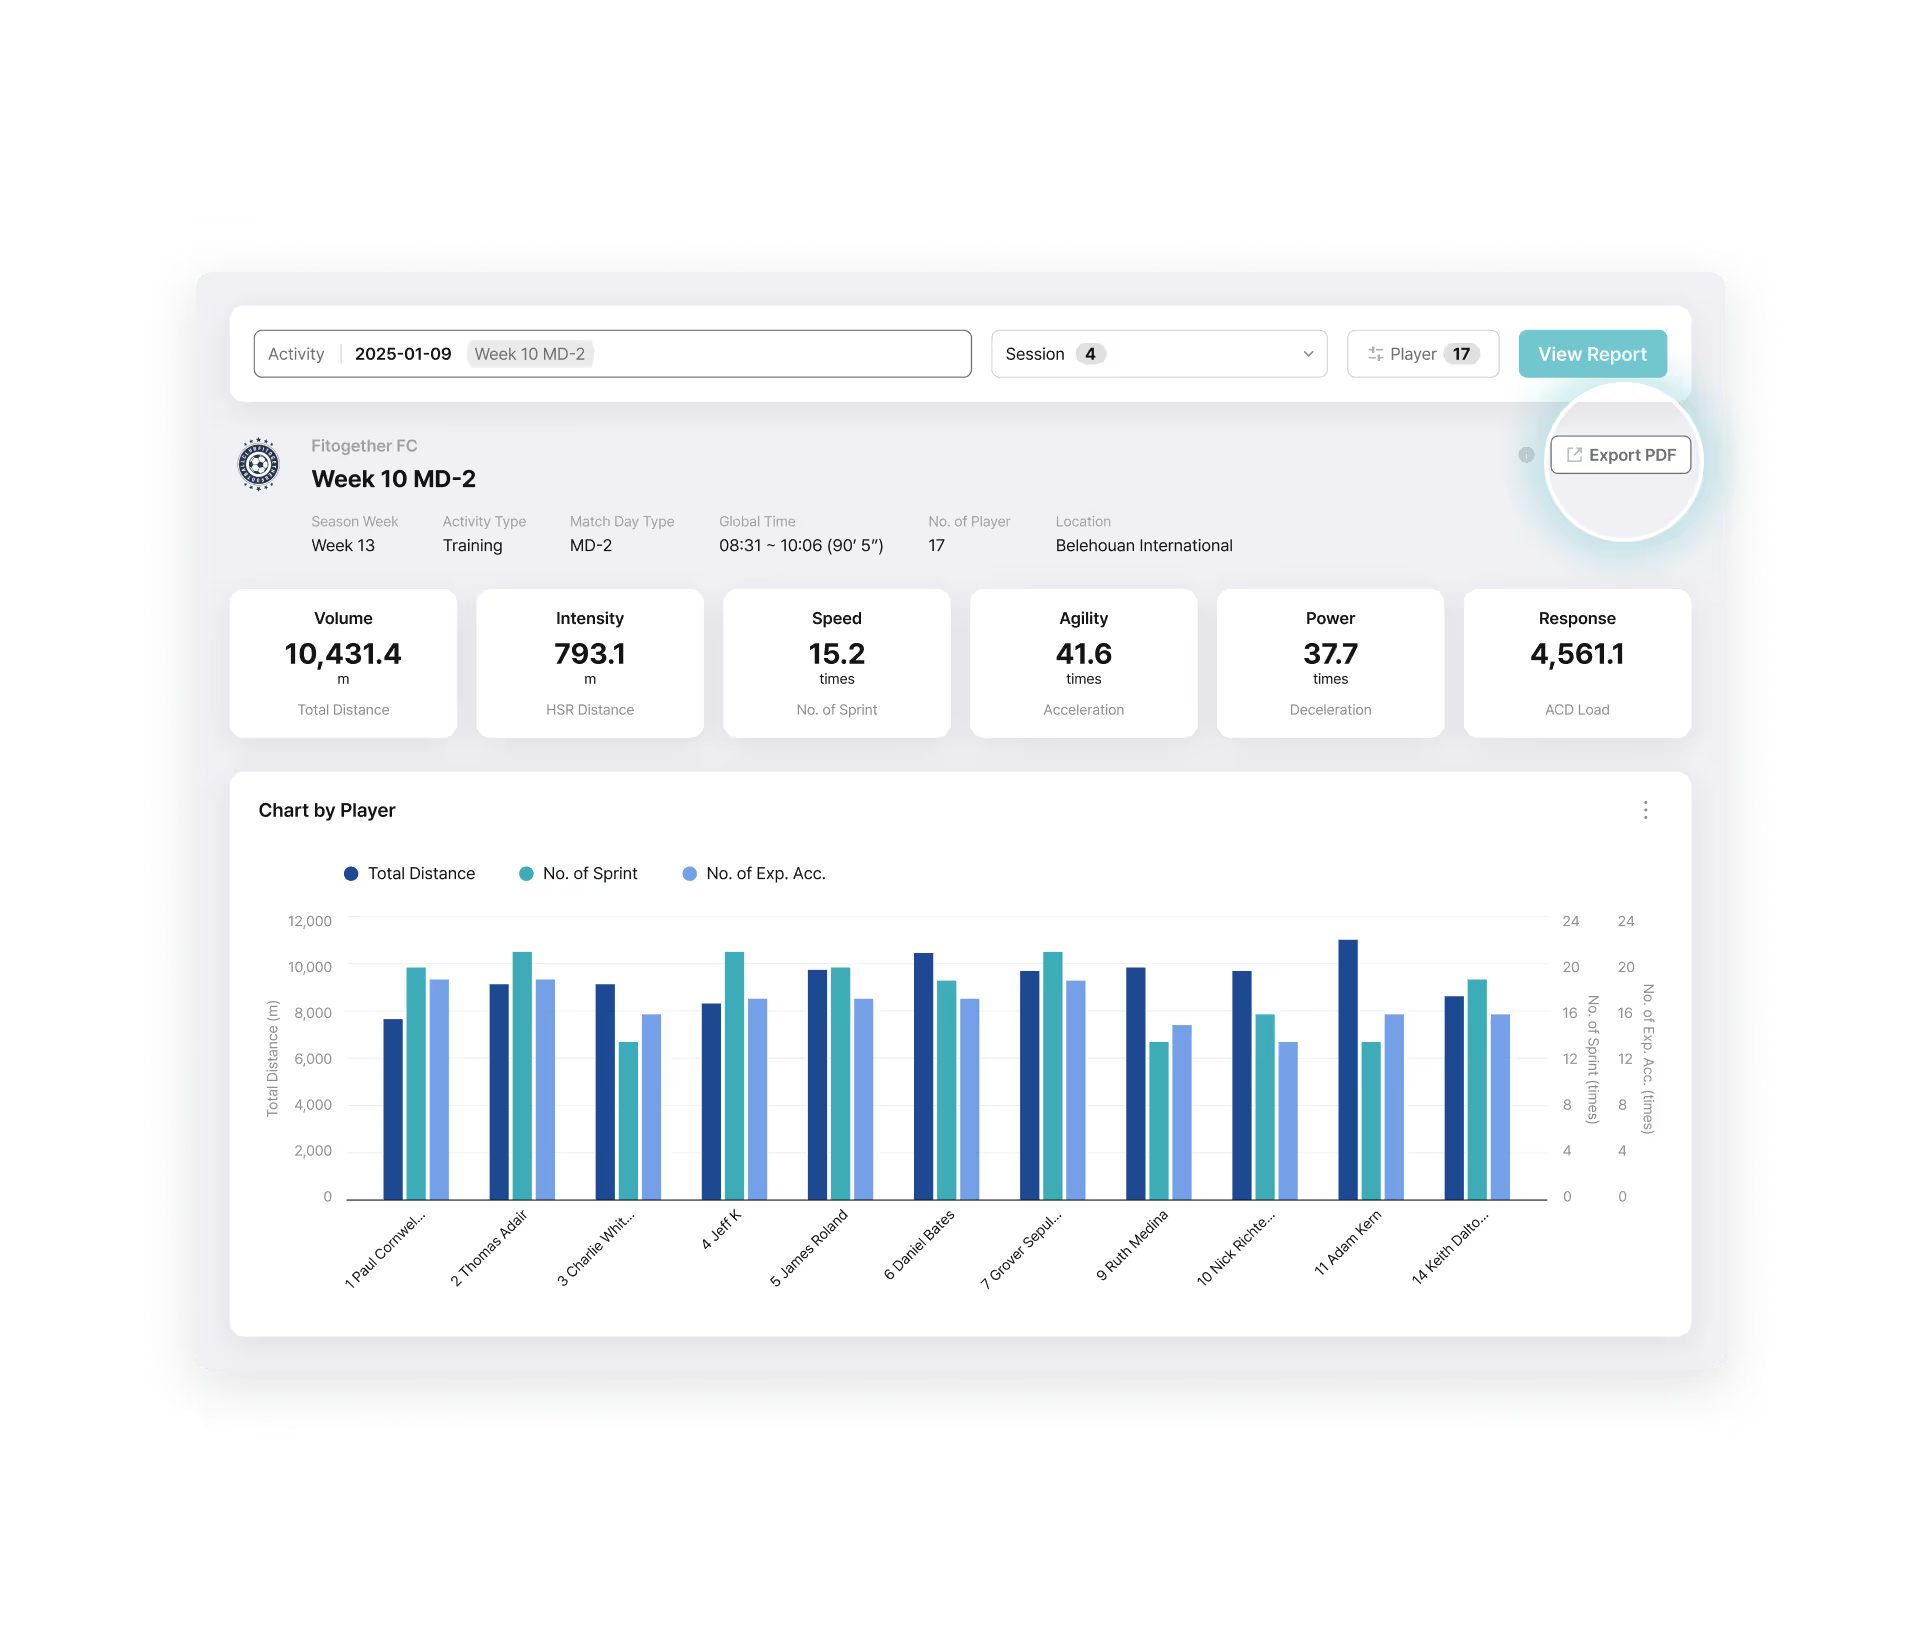
Built as one of the few truly cloud-native platforms in elite sport, Analytics enables teams to structure, analyze, visualize, and reuse performance data with ease. Powered by Fitogether’s fully cloud-native architecture, data from Cell devices is centrally stored and deeply analyzed. Training and match data are organized to support objective evaluations for individuals and teams, with customizable metrics reflecting each player’s unique profile.
Users can adjust chart types, metric order, and indicators to match analysis needs. Frequently used settings can be saved as templates for fast, consistent reporting. API and export tools simplify integration with club data systems or dashboards.
Metric Category
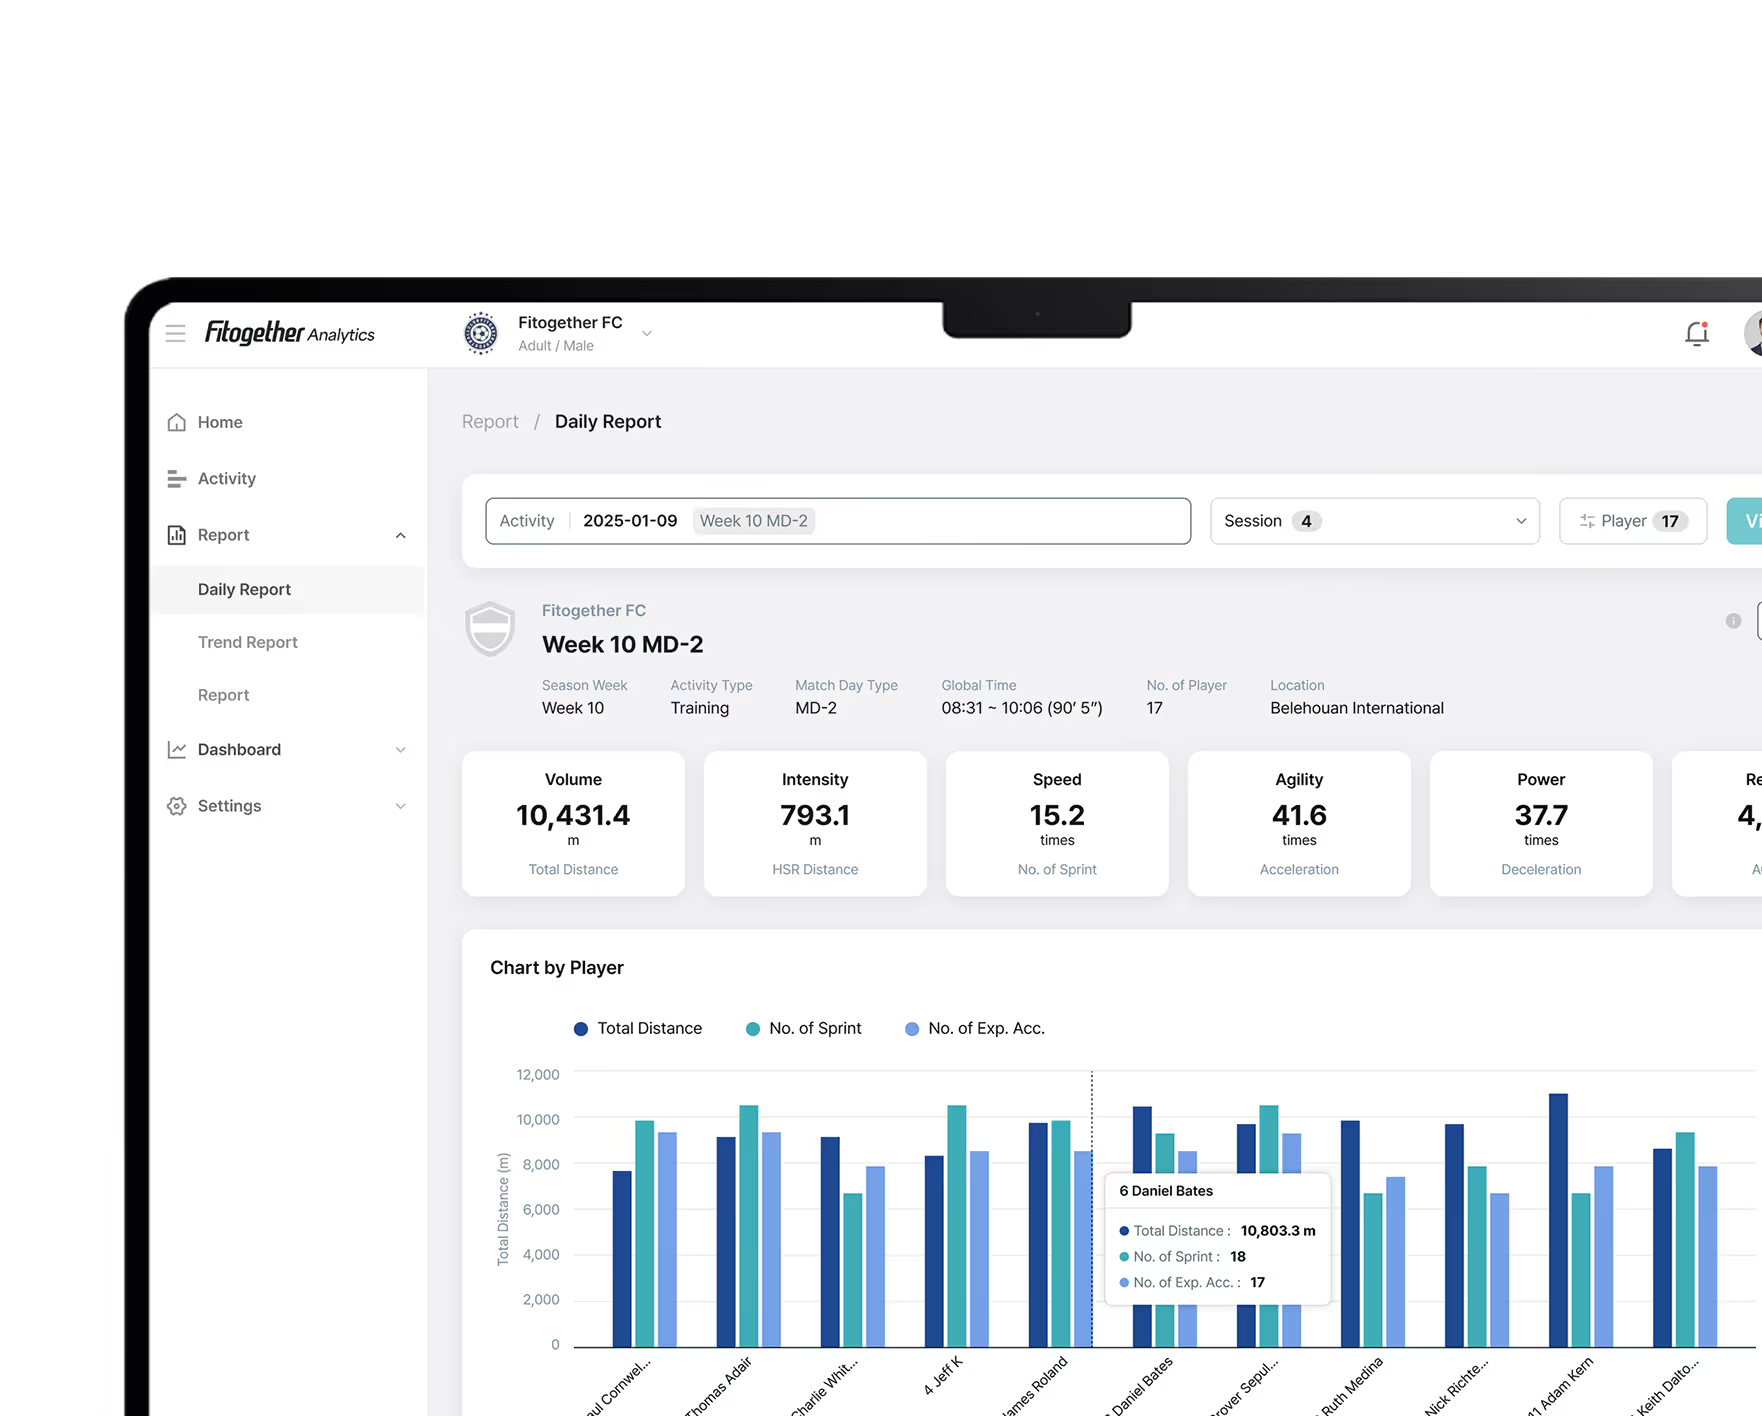
Comprehensive Metrics for Elite Performance Analysis
- Running: Sprint, High-Speed Running, Explosive Acceleration
- Positional: Heatmap, 18-Zone Analysis, Action Map
- Inertial: Jump and Dive
- Physiological: Heart Rate (HR), Rating of Perceived Exertion (RPE)
Thresholding & Individulizing
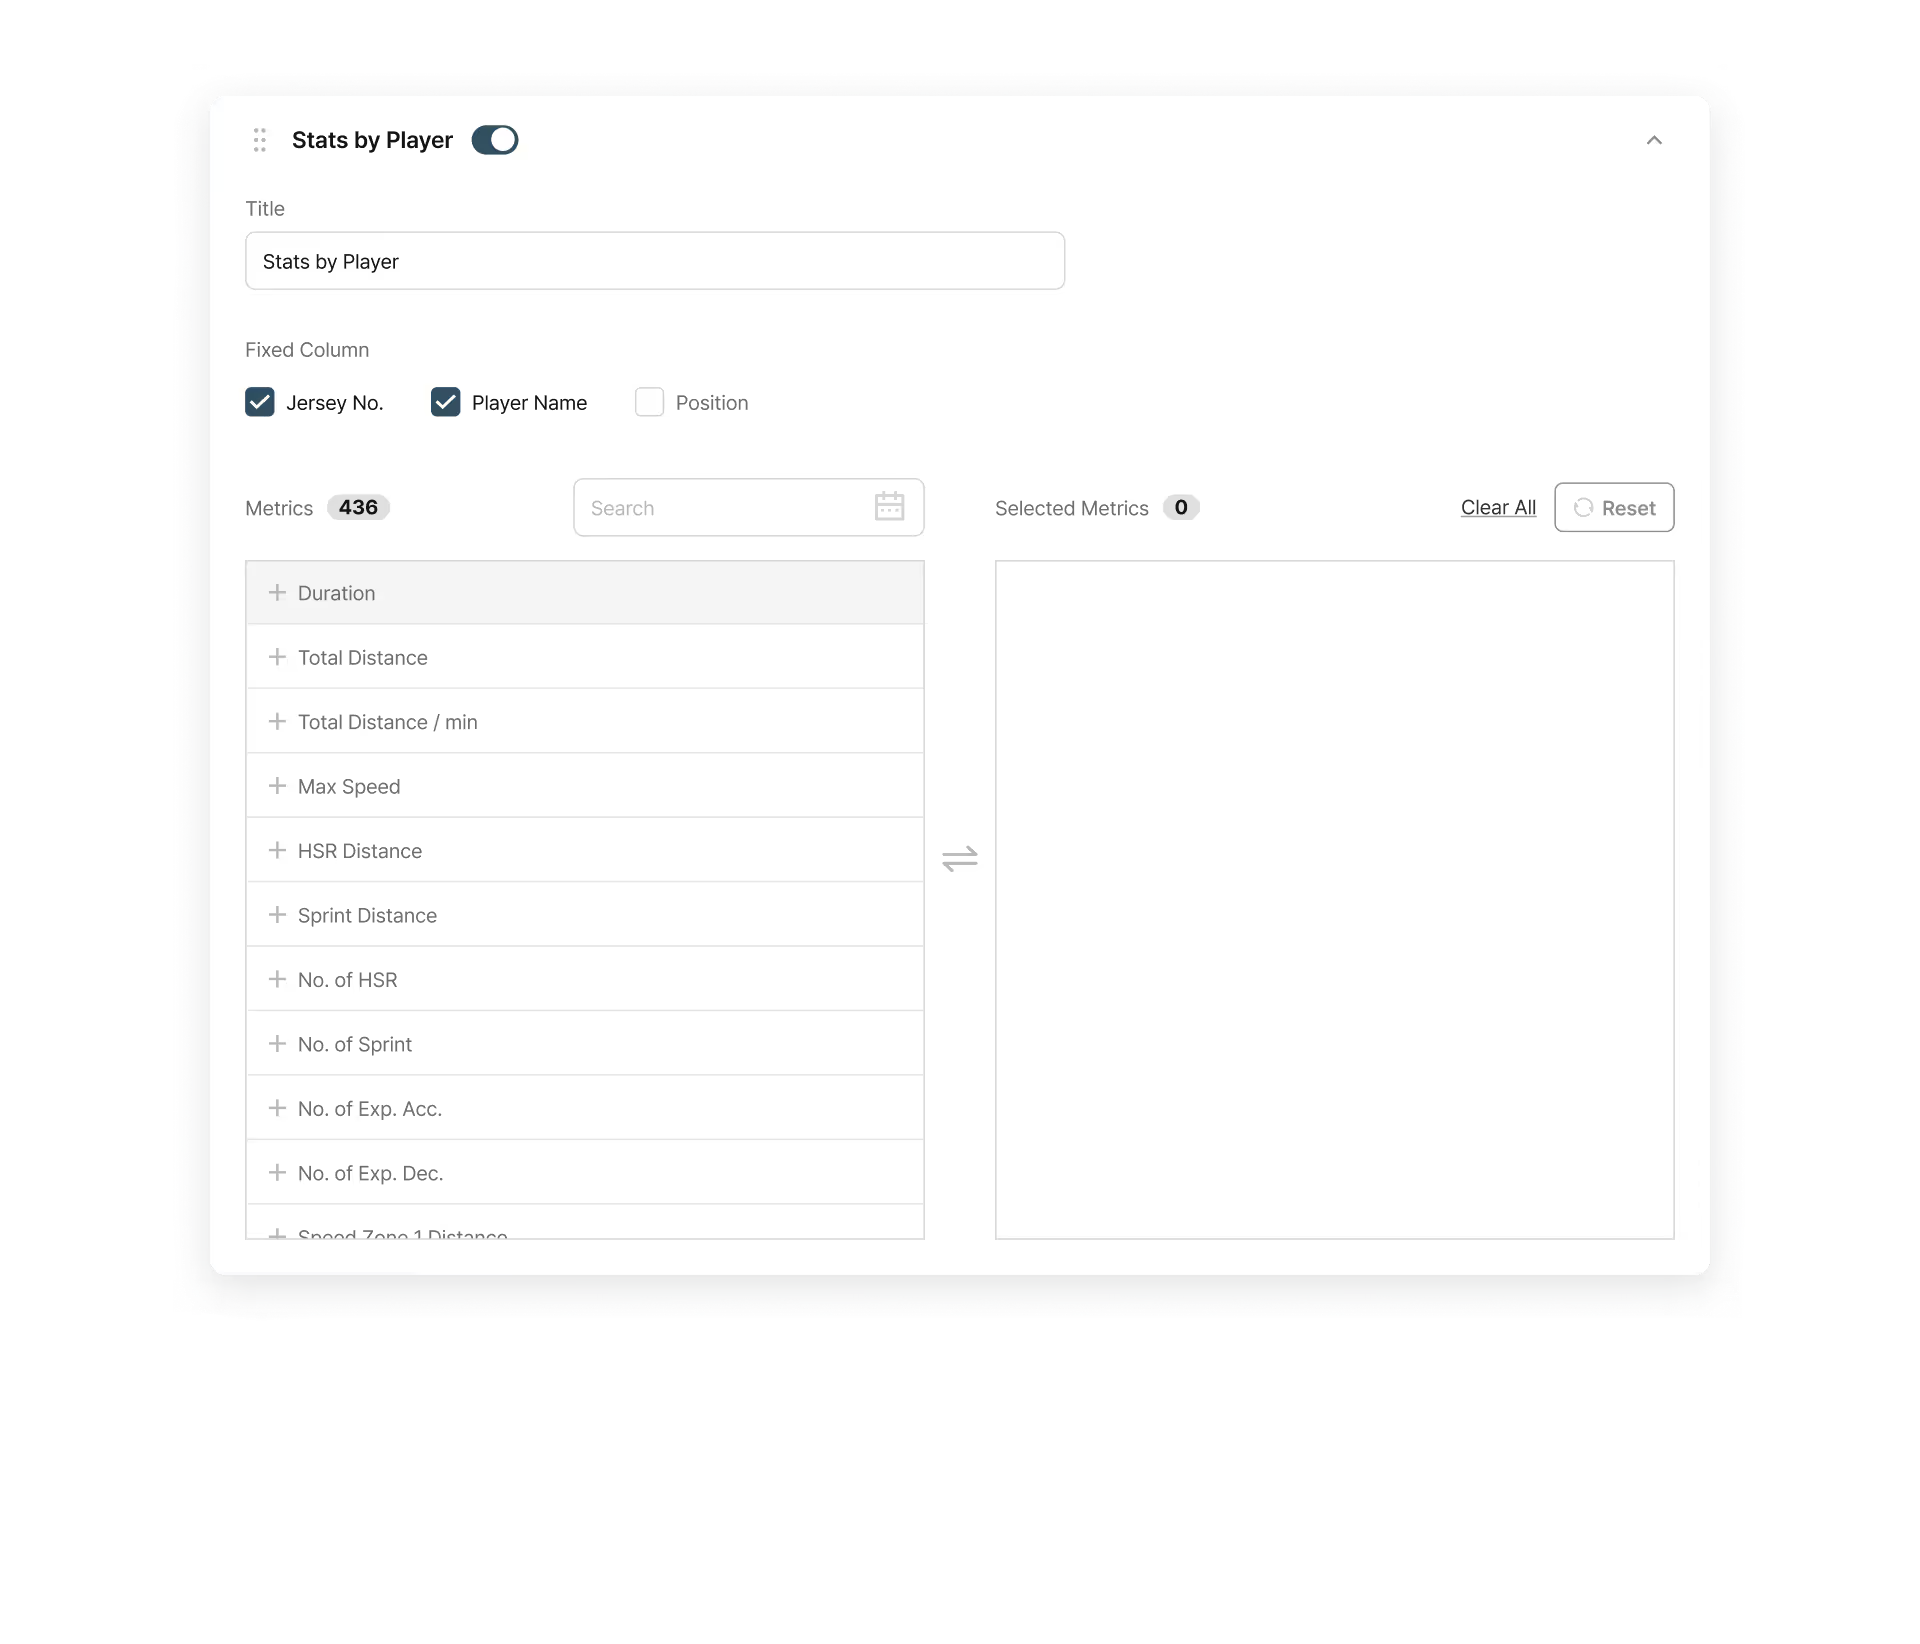
Customized Performance & Load Metrics
- Team Level: Shared Threshold and Zone settings for the entire team (expandable up to 10 zones)
- Player Level: Zones adjusted to individual max values, with thresholds and history tracking.
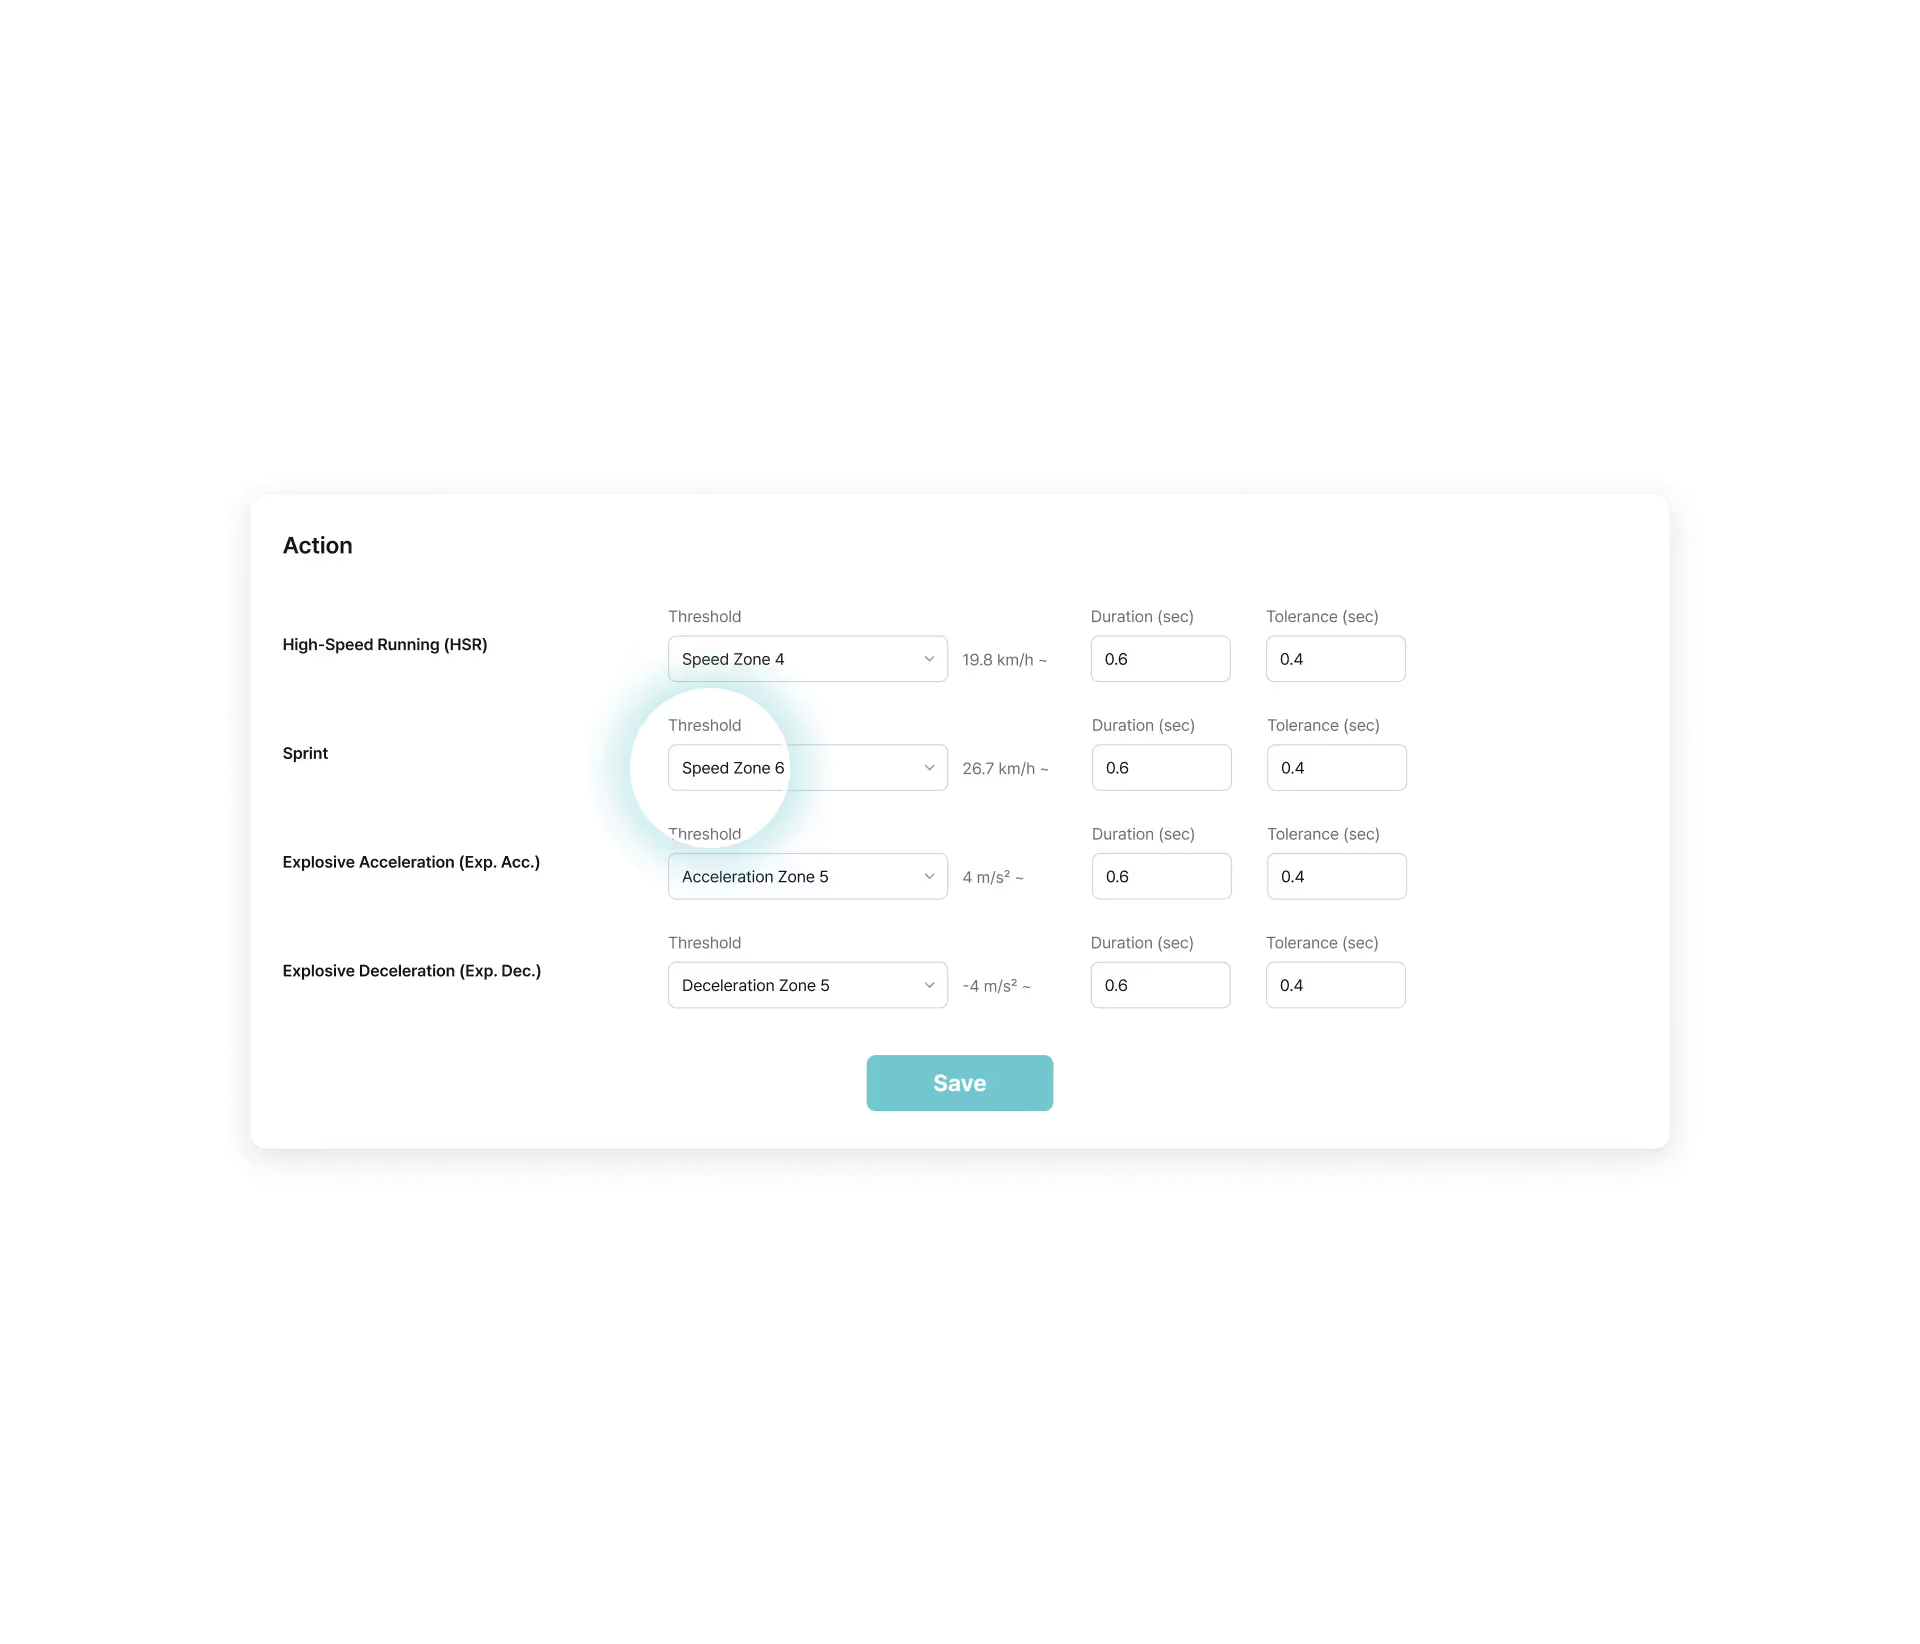
Action Customization
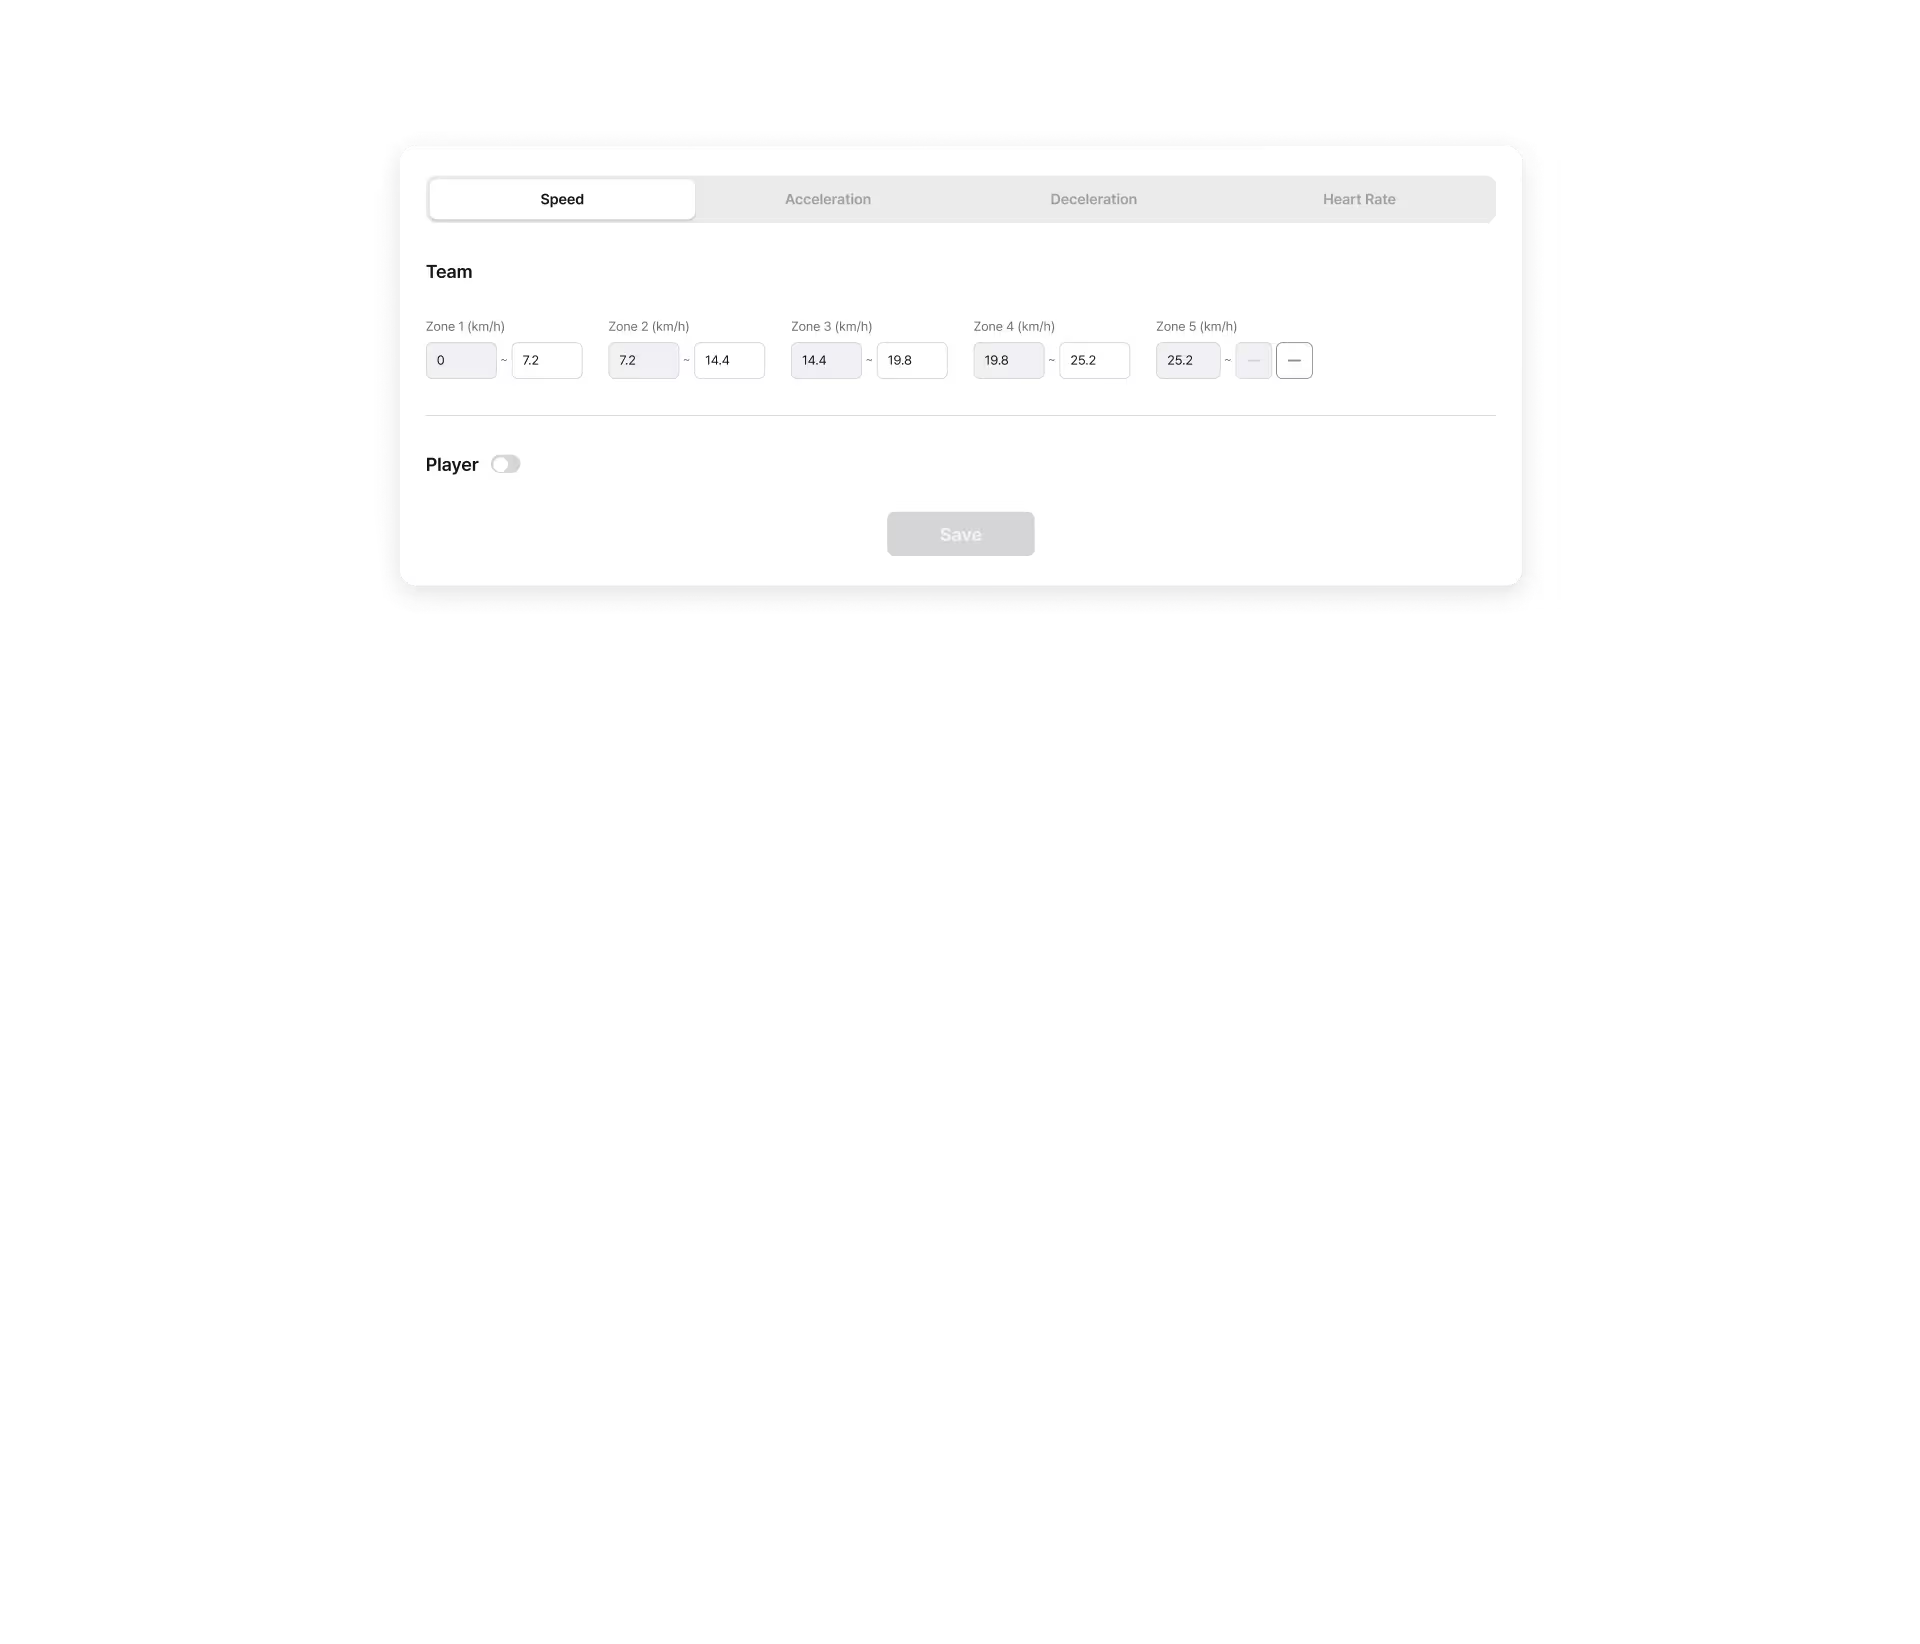
Precise Definition and Criteria for Key Physical Actions
- Threshold: Sets the criteria for when a specific action is triggered
- Duration: Defines the minimum time an action must exceed the threshold
- Tolerance: Establishes the acceptable time margin near the threshold
Data Grouping
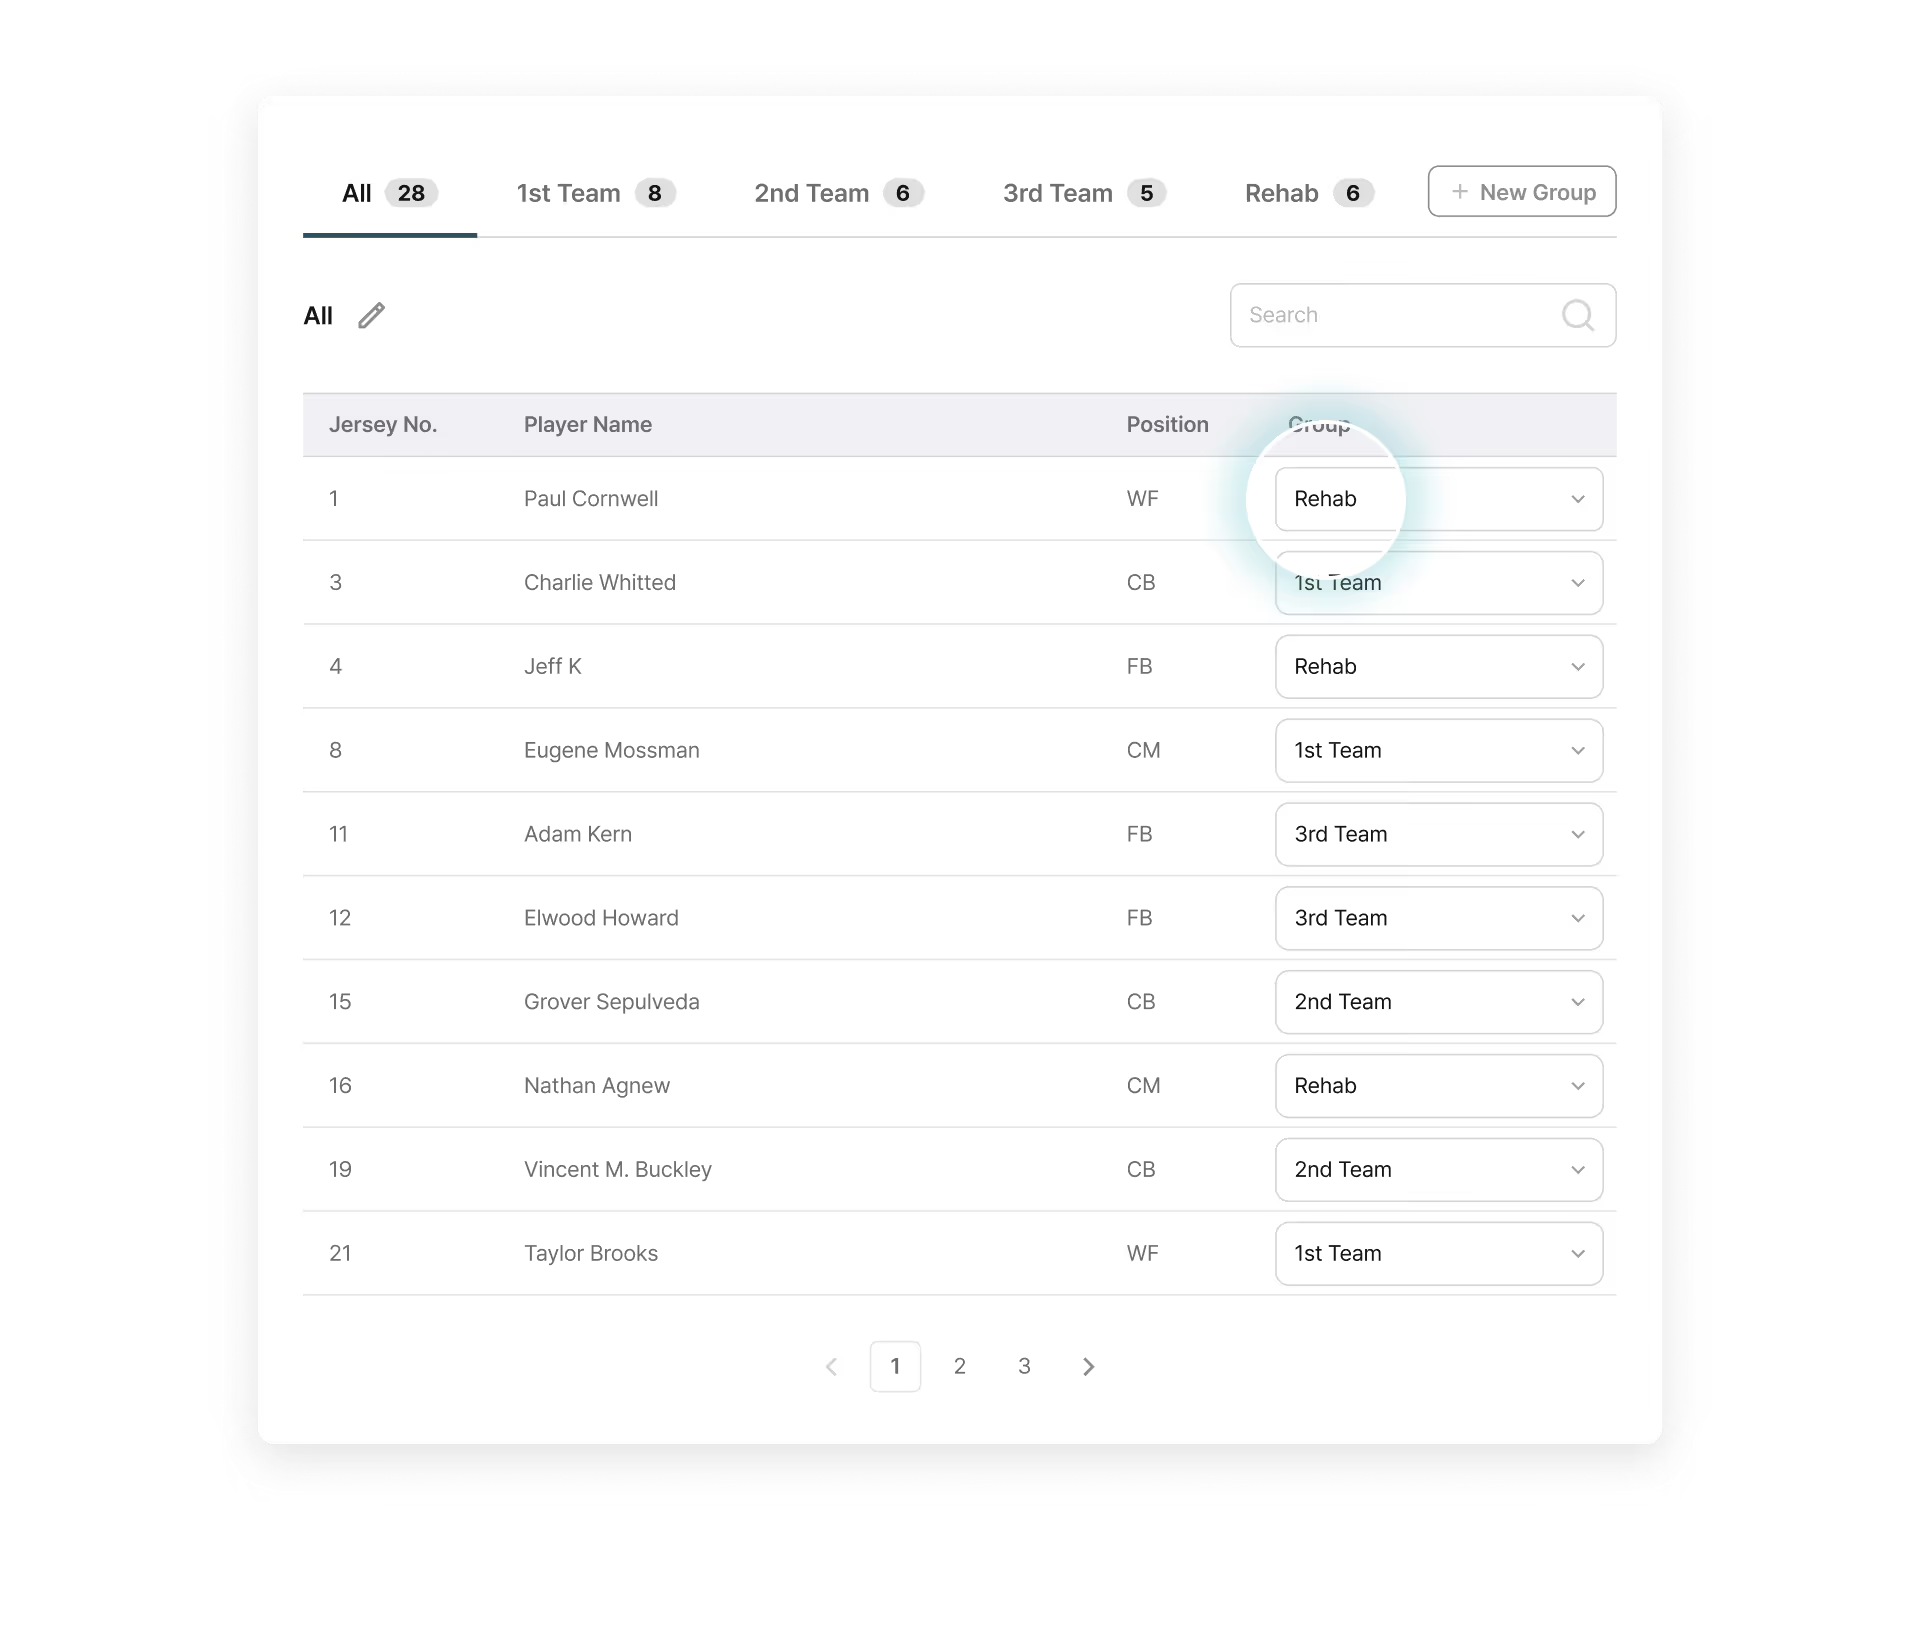
Multi-Dimensional Classification for Systematic Data Management
- Player Grouping: Organizes data by position groups or specific player groups
- Training & Match Categorization: Sorts data by matches, training, or recovery
Session Tagging
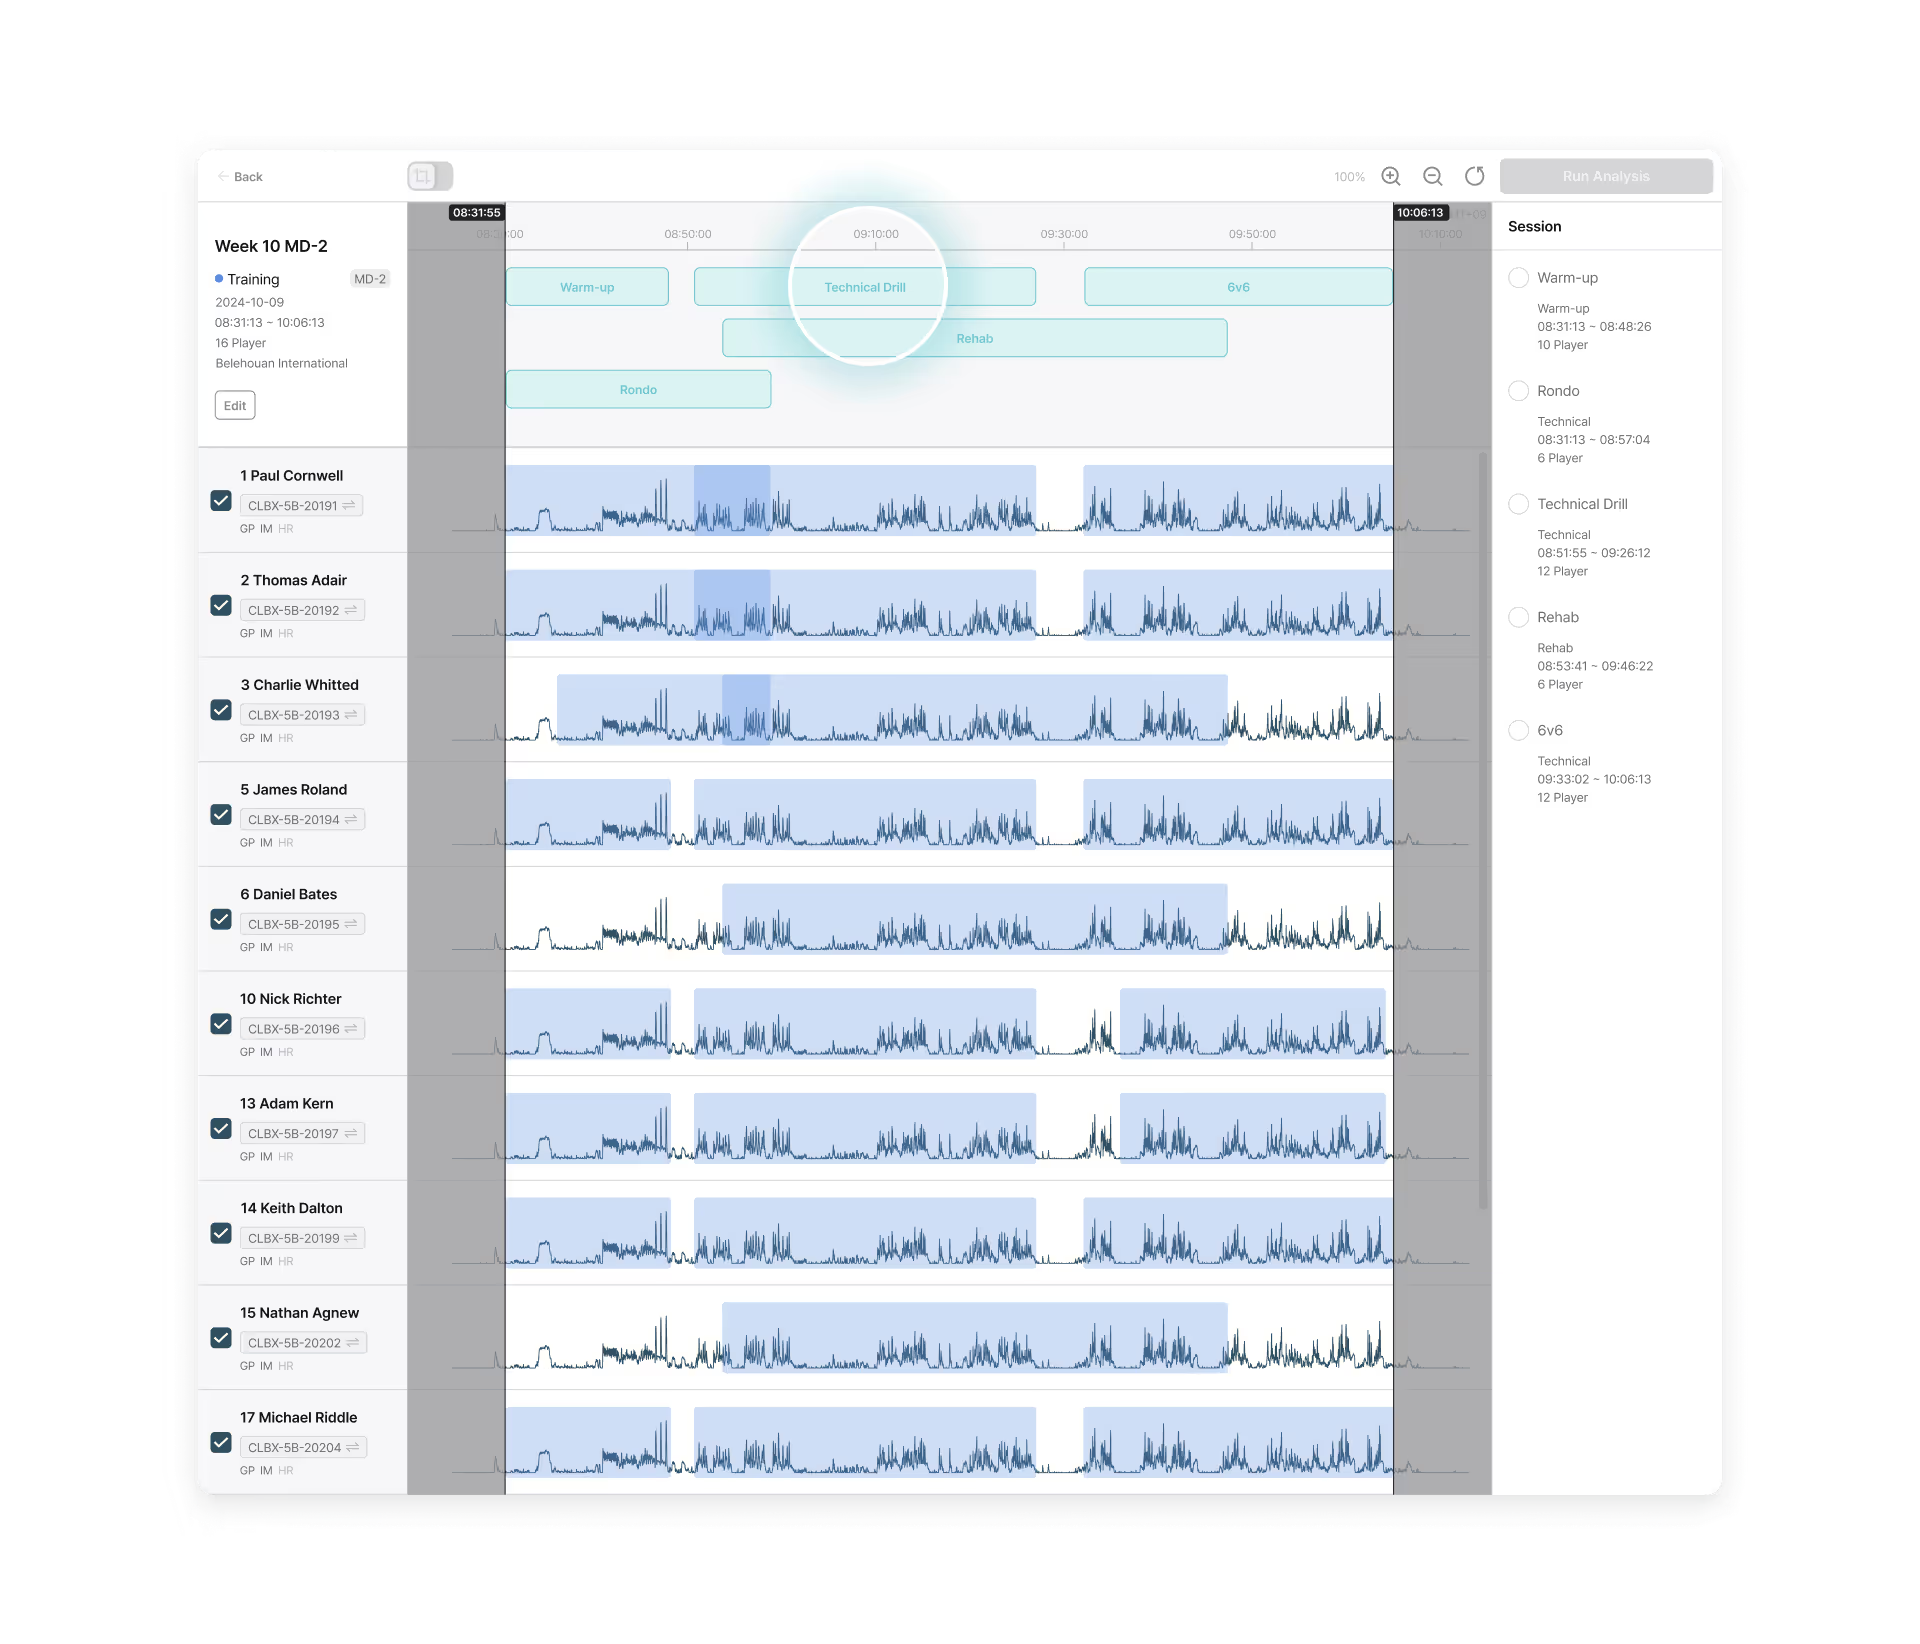
Powerful Tagging for Easy and Accurate Training
- Player Participation Adjustment: Modify session data with second-level precision for accuracy
- Multi-Session Management: Efficiently manage multiple sessions running simultaneously
- Data Cleaning & Cropping: Filter out unnecessary data to improve analysis clarity
- Zoom In/Out Visualization Tools: Scale speed graphs and other visual data for in-depth review
Analysis Scope Defining
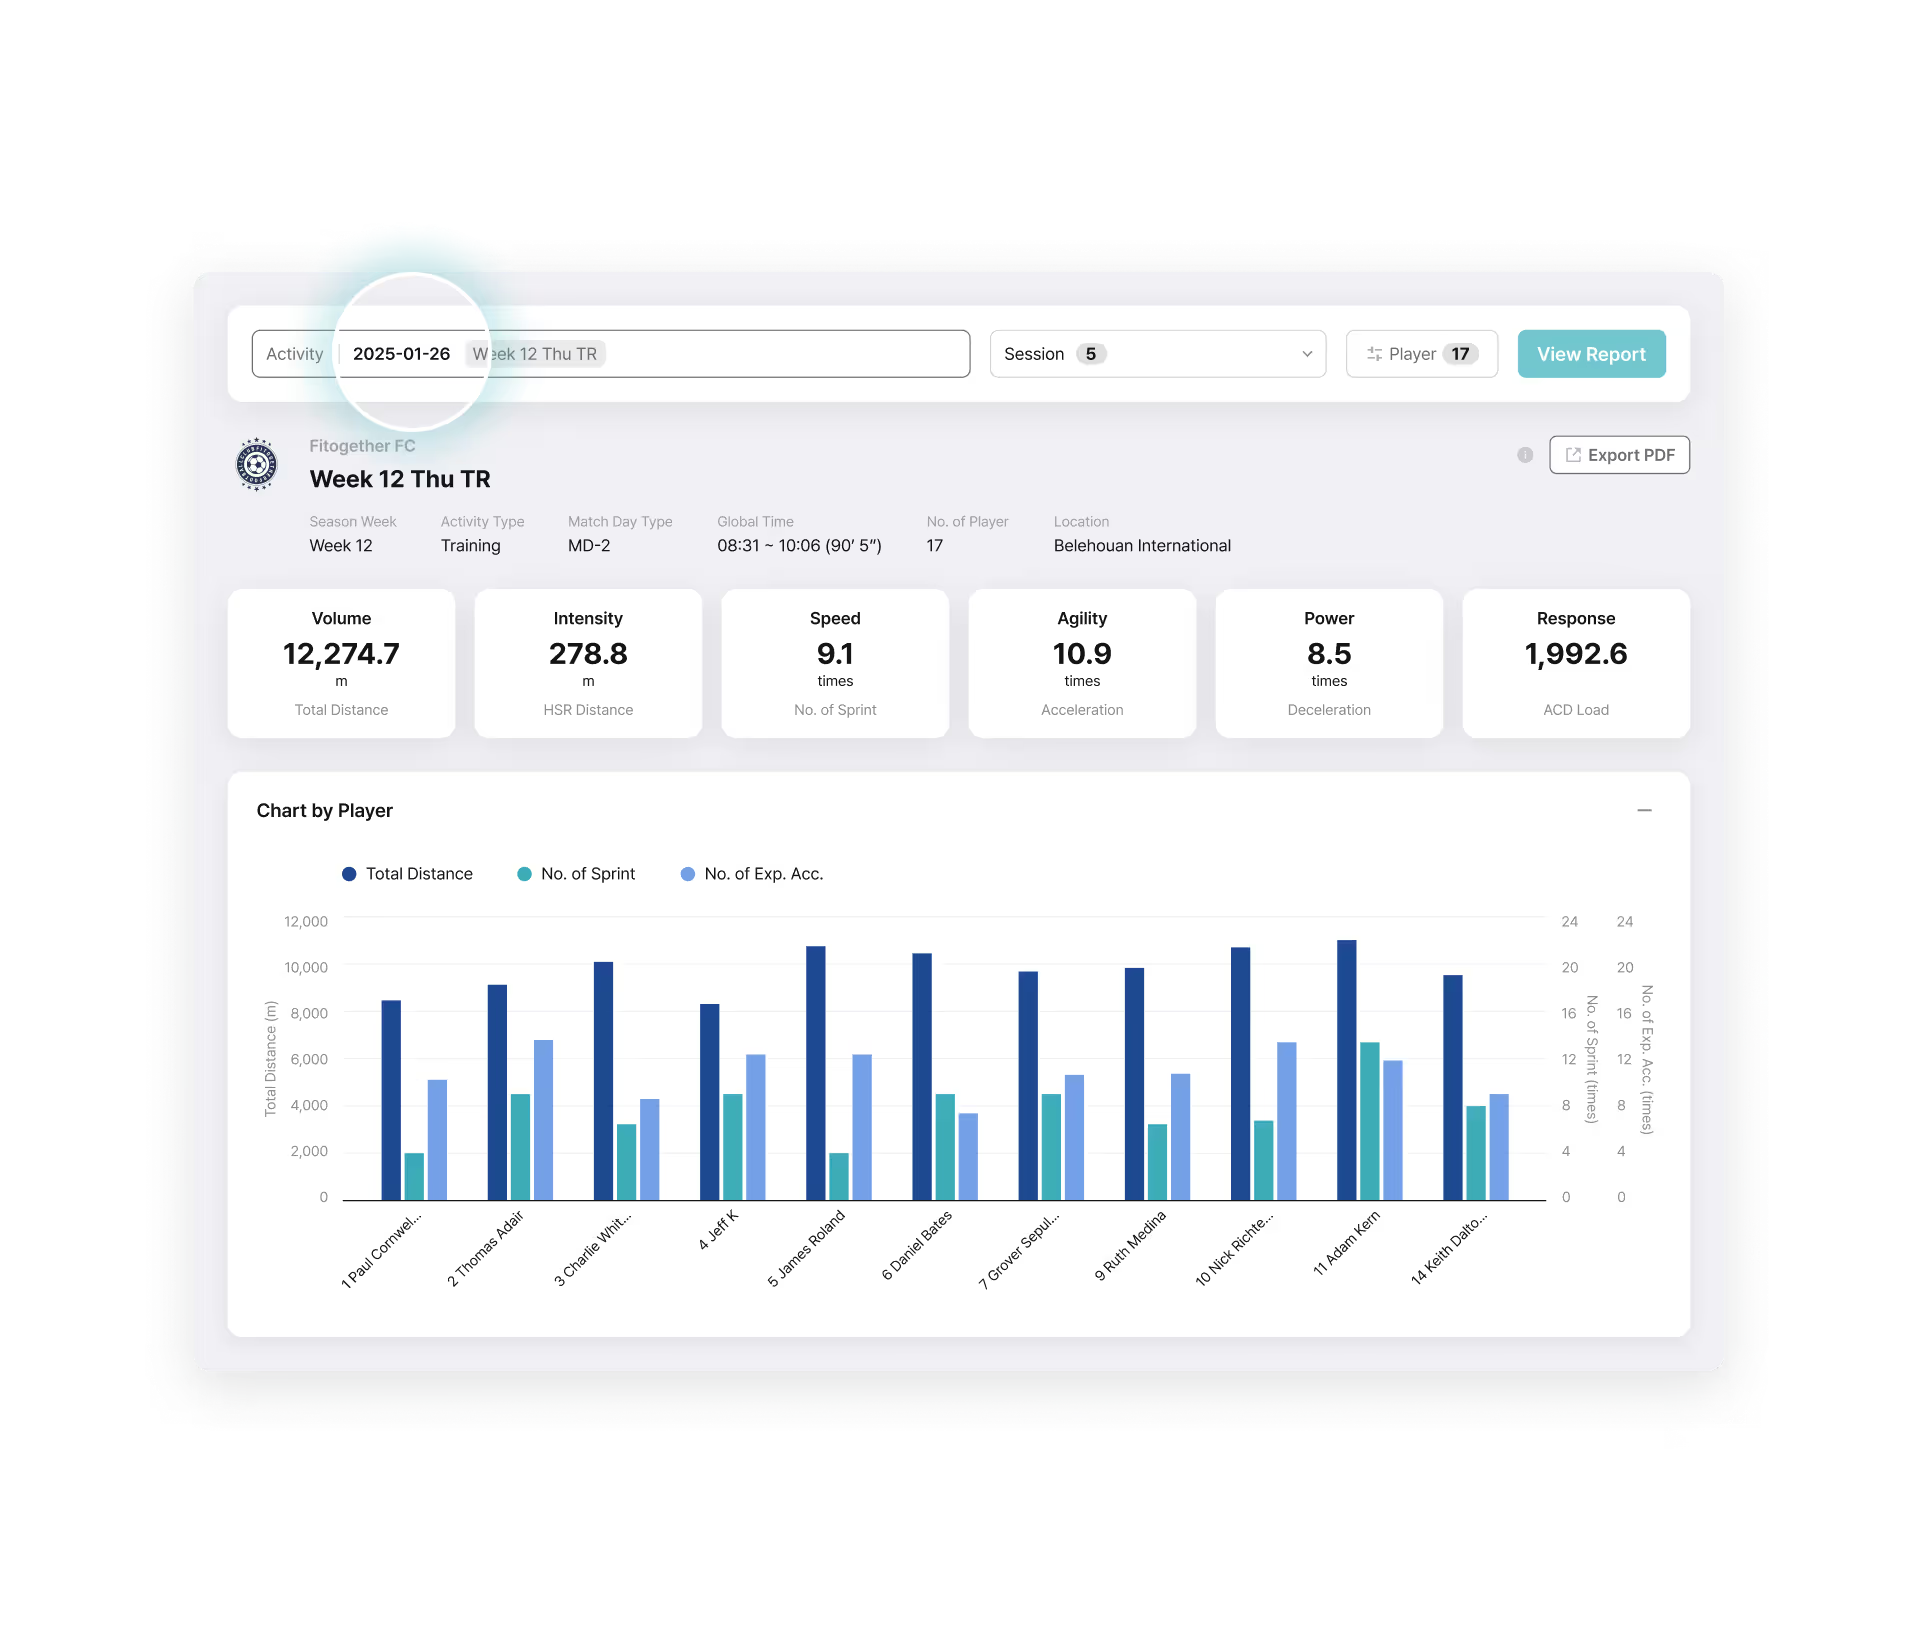
Pinpoint and Filter the Data that Matters
- Time Range: Select a period (e.g., Match Day phase, season week) or enter a custom range
- Activity Type Filtering: Choose data use, such as matches, tactical training, or recovery
- Player Group & Position Selection: Analyze position groups or individual players
- Key Metric Exploration: Analyze metrics like High-Speed Running, Max Speed, and Acceleration
Daily Report
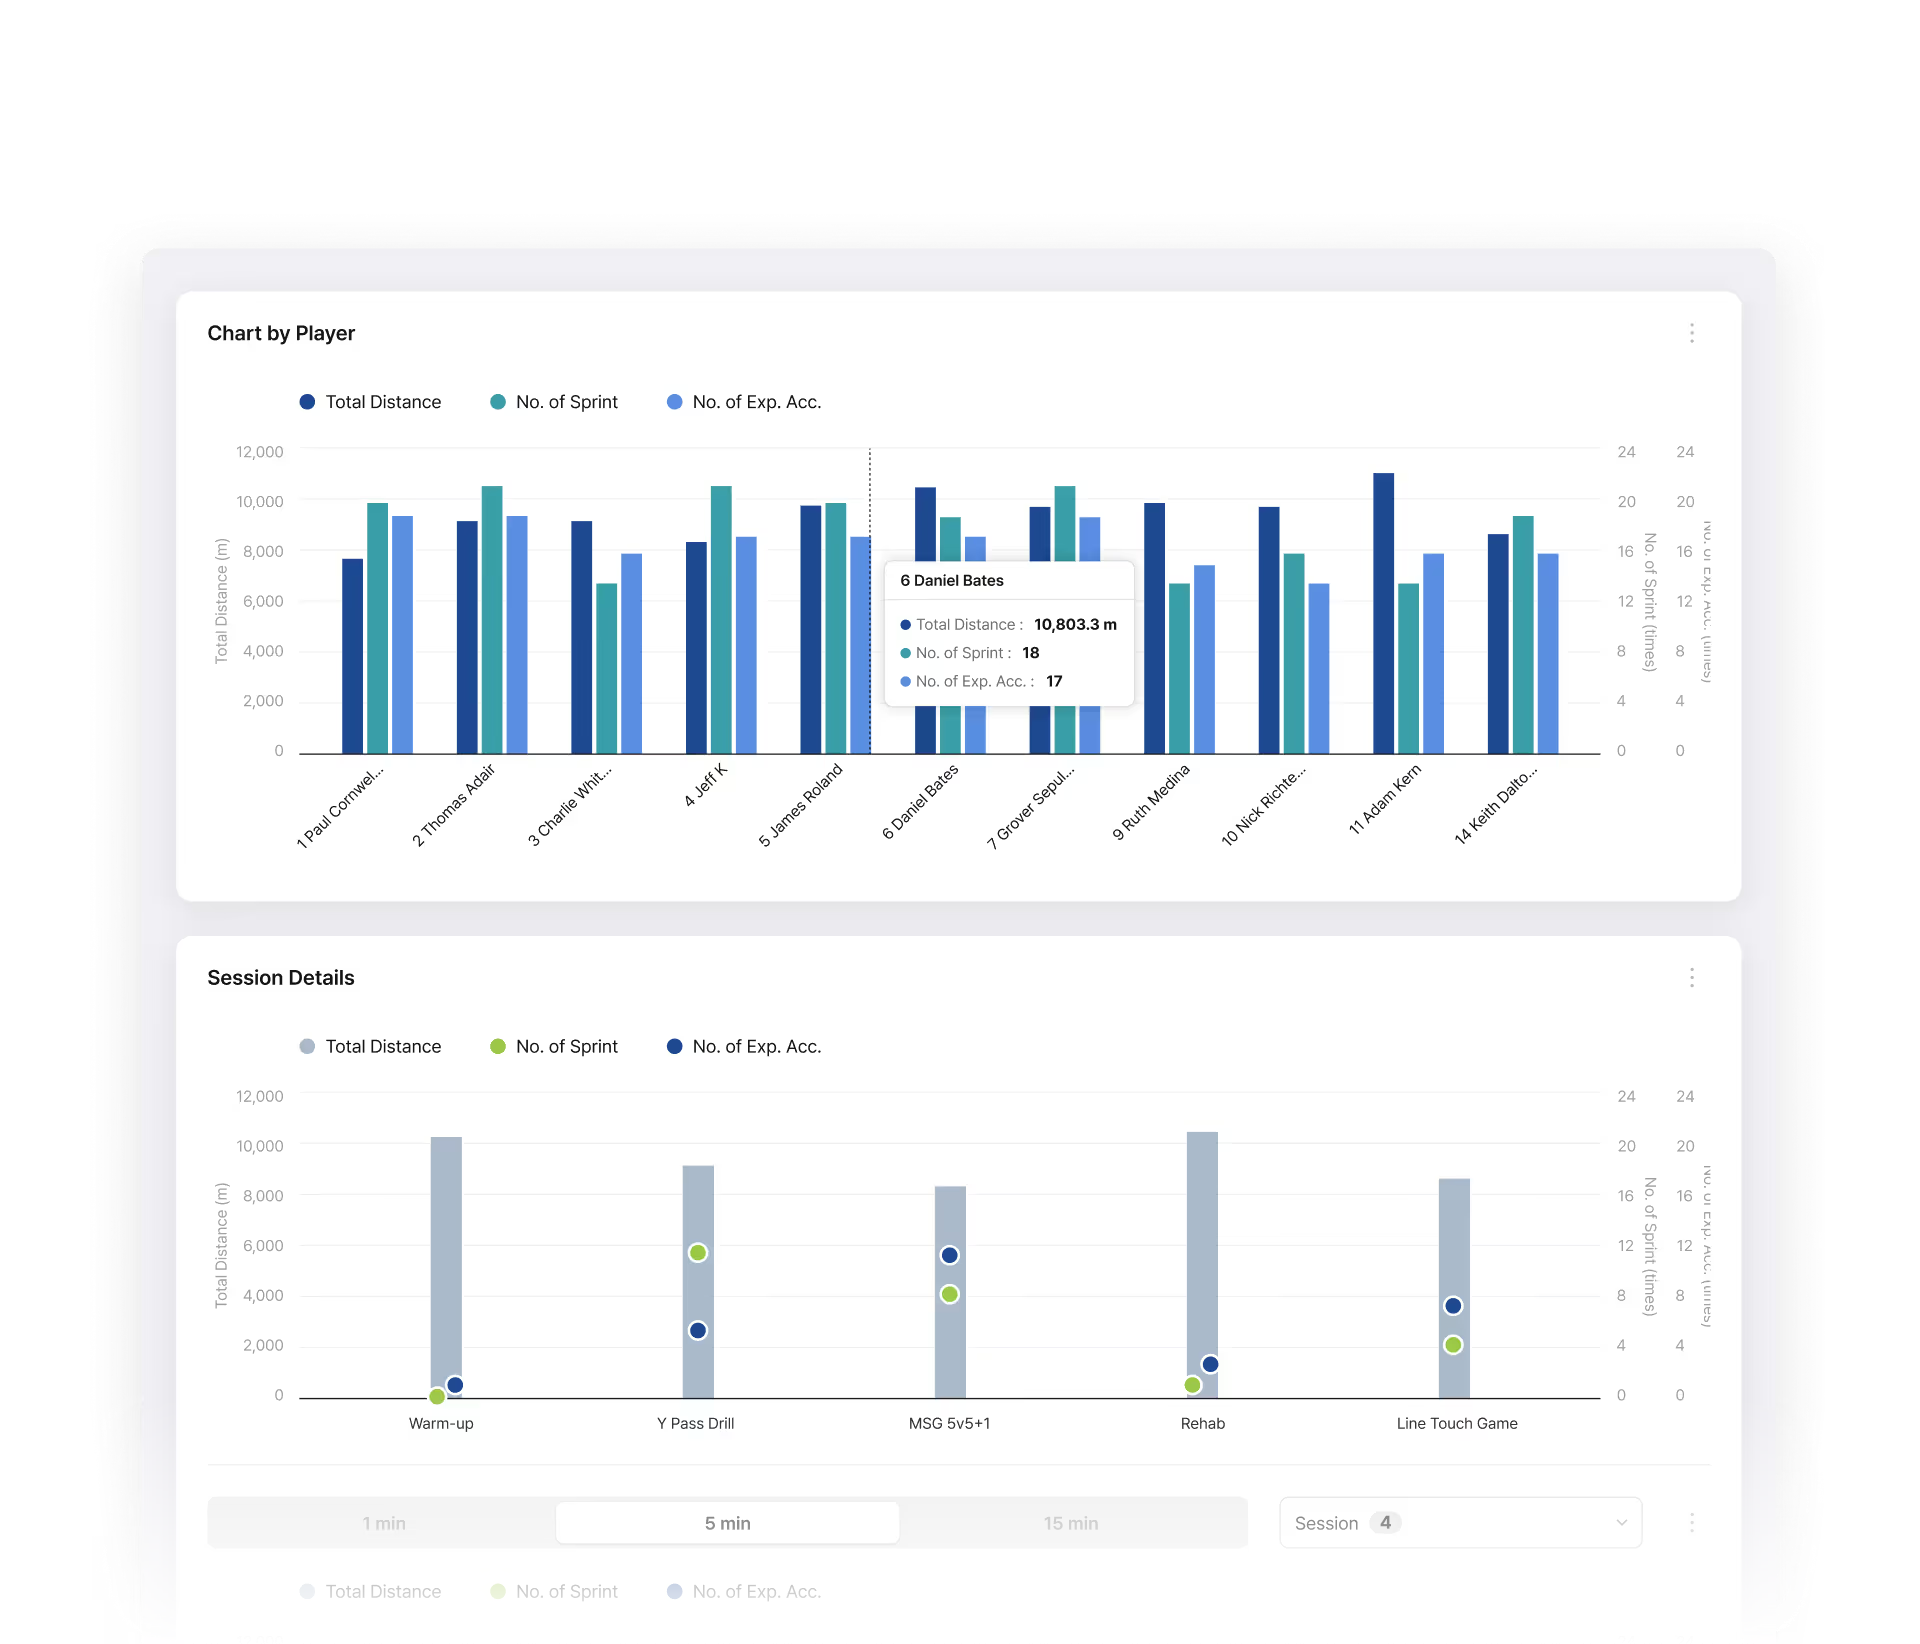
Performance Report per Training or Match Activity
- Player Comparison: Compare performance using unified metrics
- Session Breakdown: Compare Sessions within an Activity to analyze structure
- Action Visualization: Analyze timing and location of key actions
- Metric Table: Sort and review key performance indicators
Trend Report
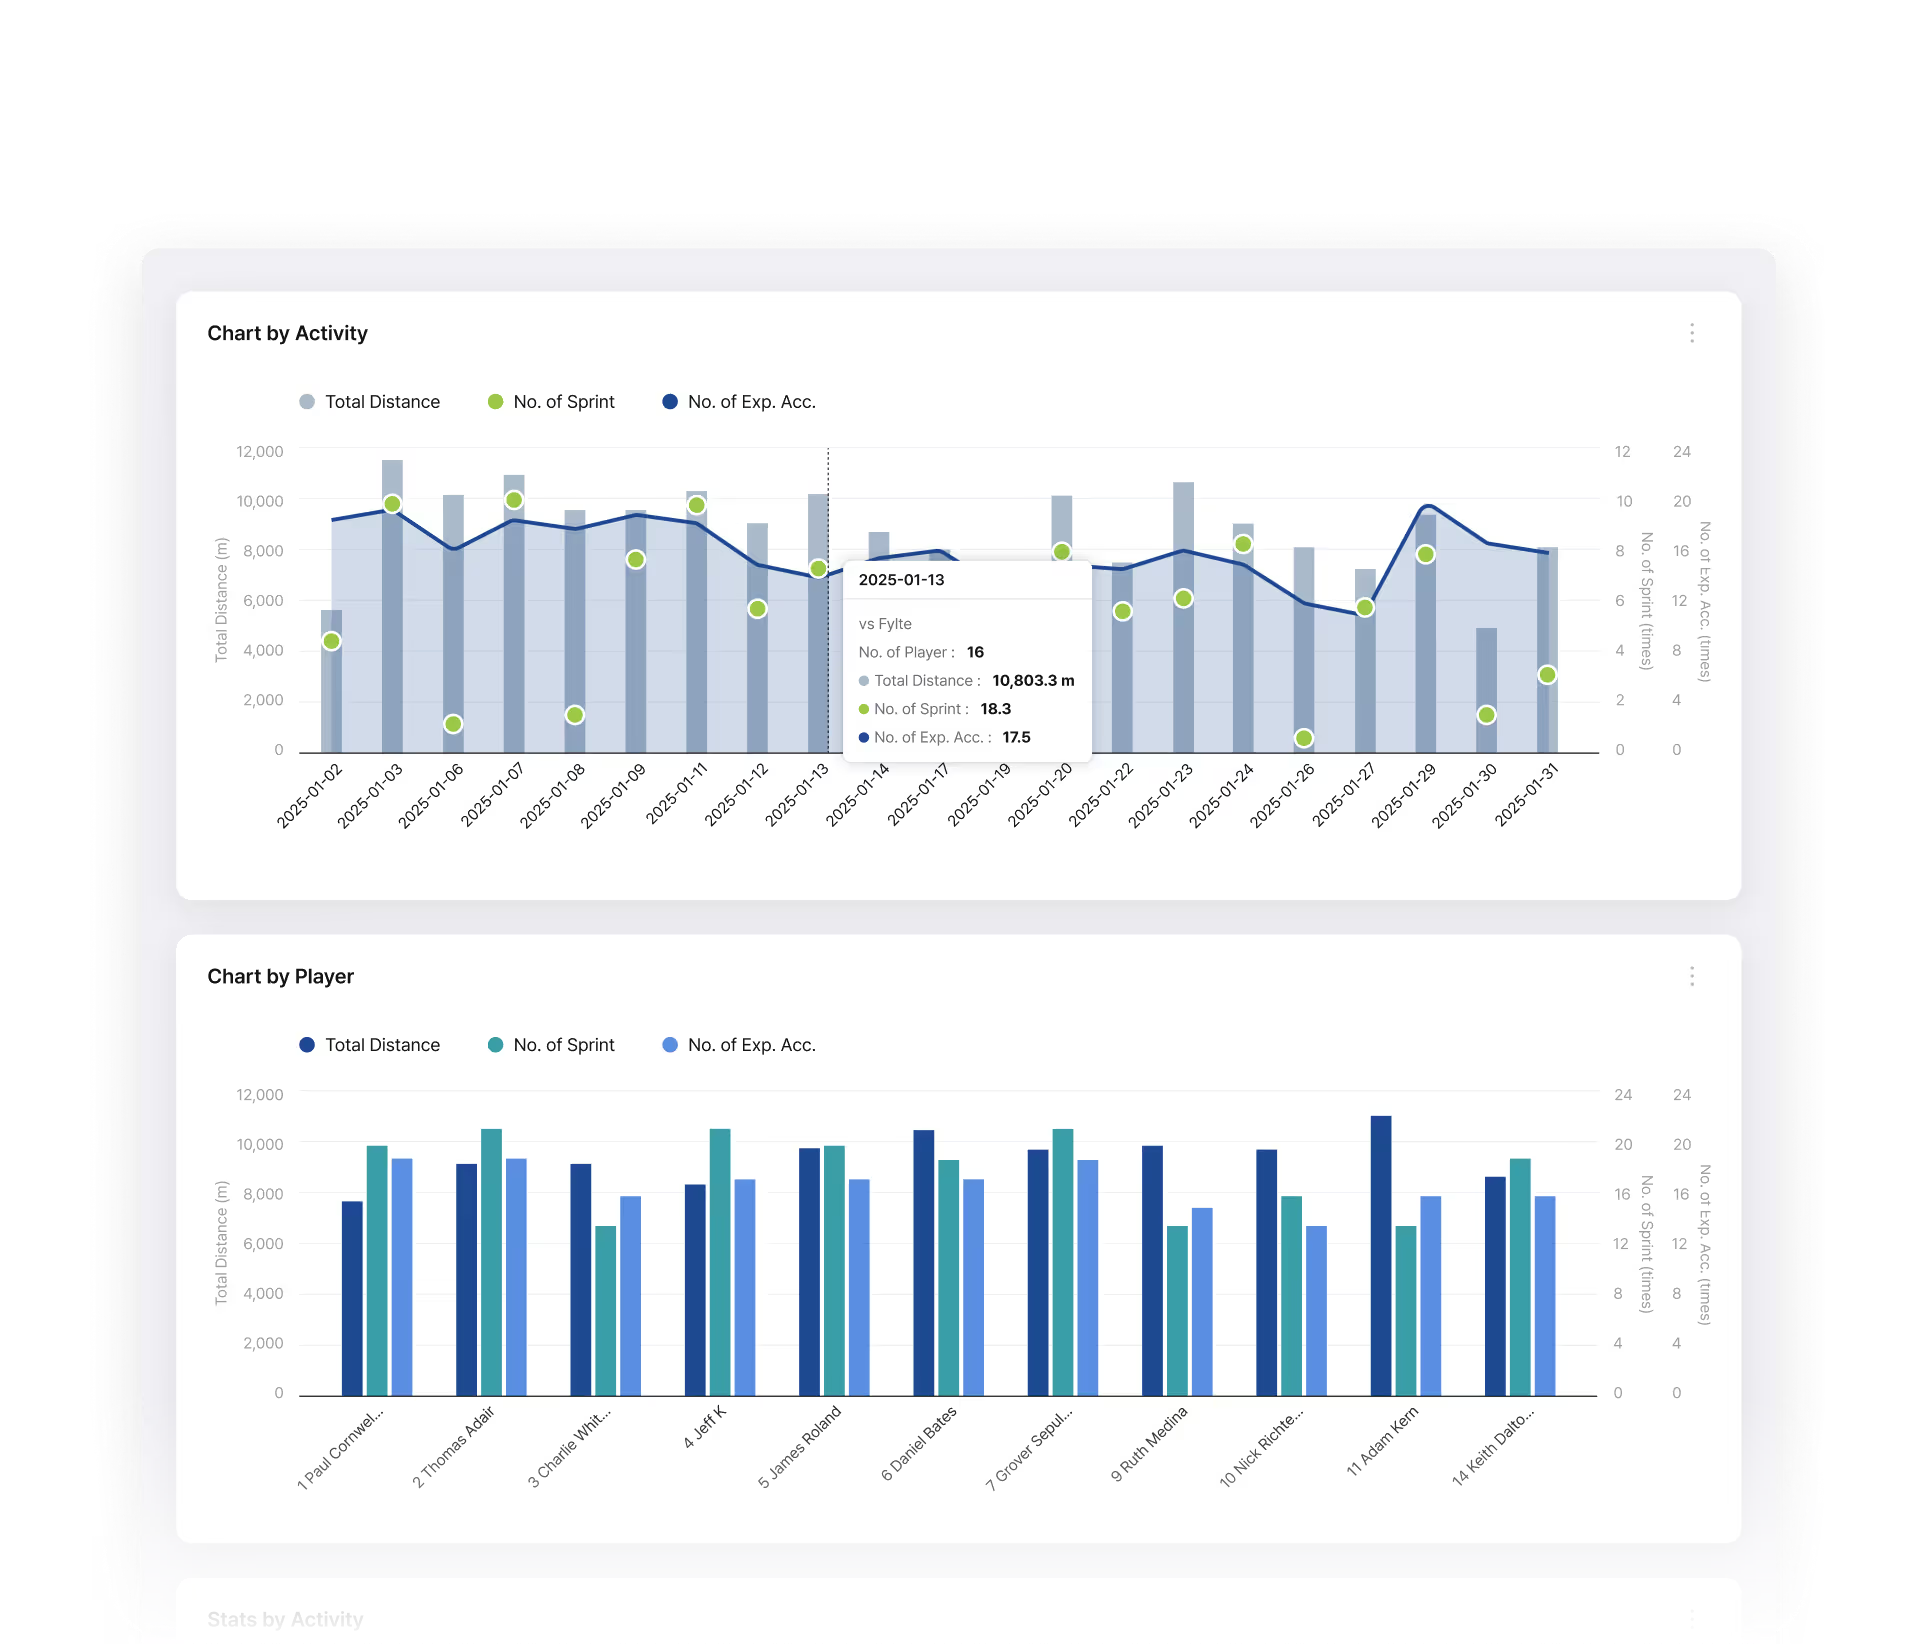
Performance Trends Based on Accumulated Data
- Activity Metric Trend: Track changes in key metrics across Activities
- Player Metric Comparison: Compare average and total values by player
- Cumulative Metric Table: View trends and totals across all Activities
Visualizing & Customizing
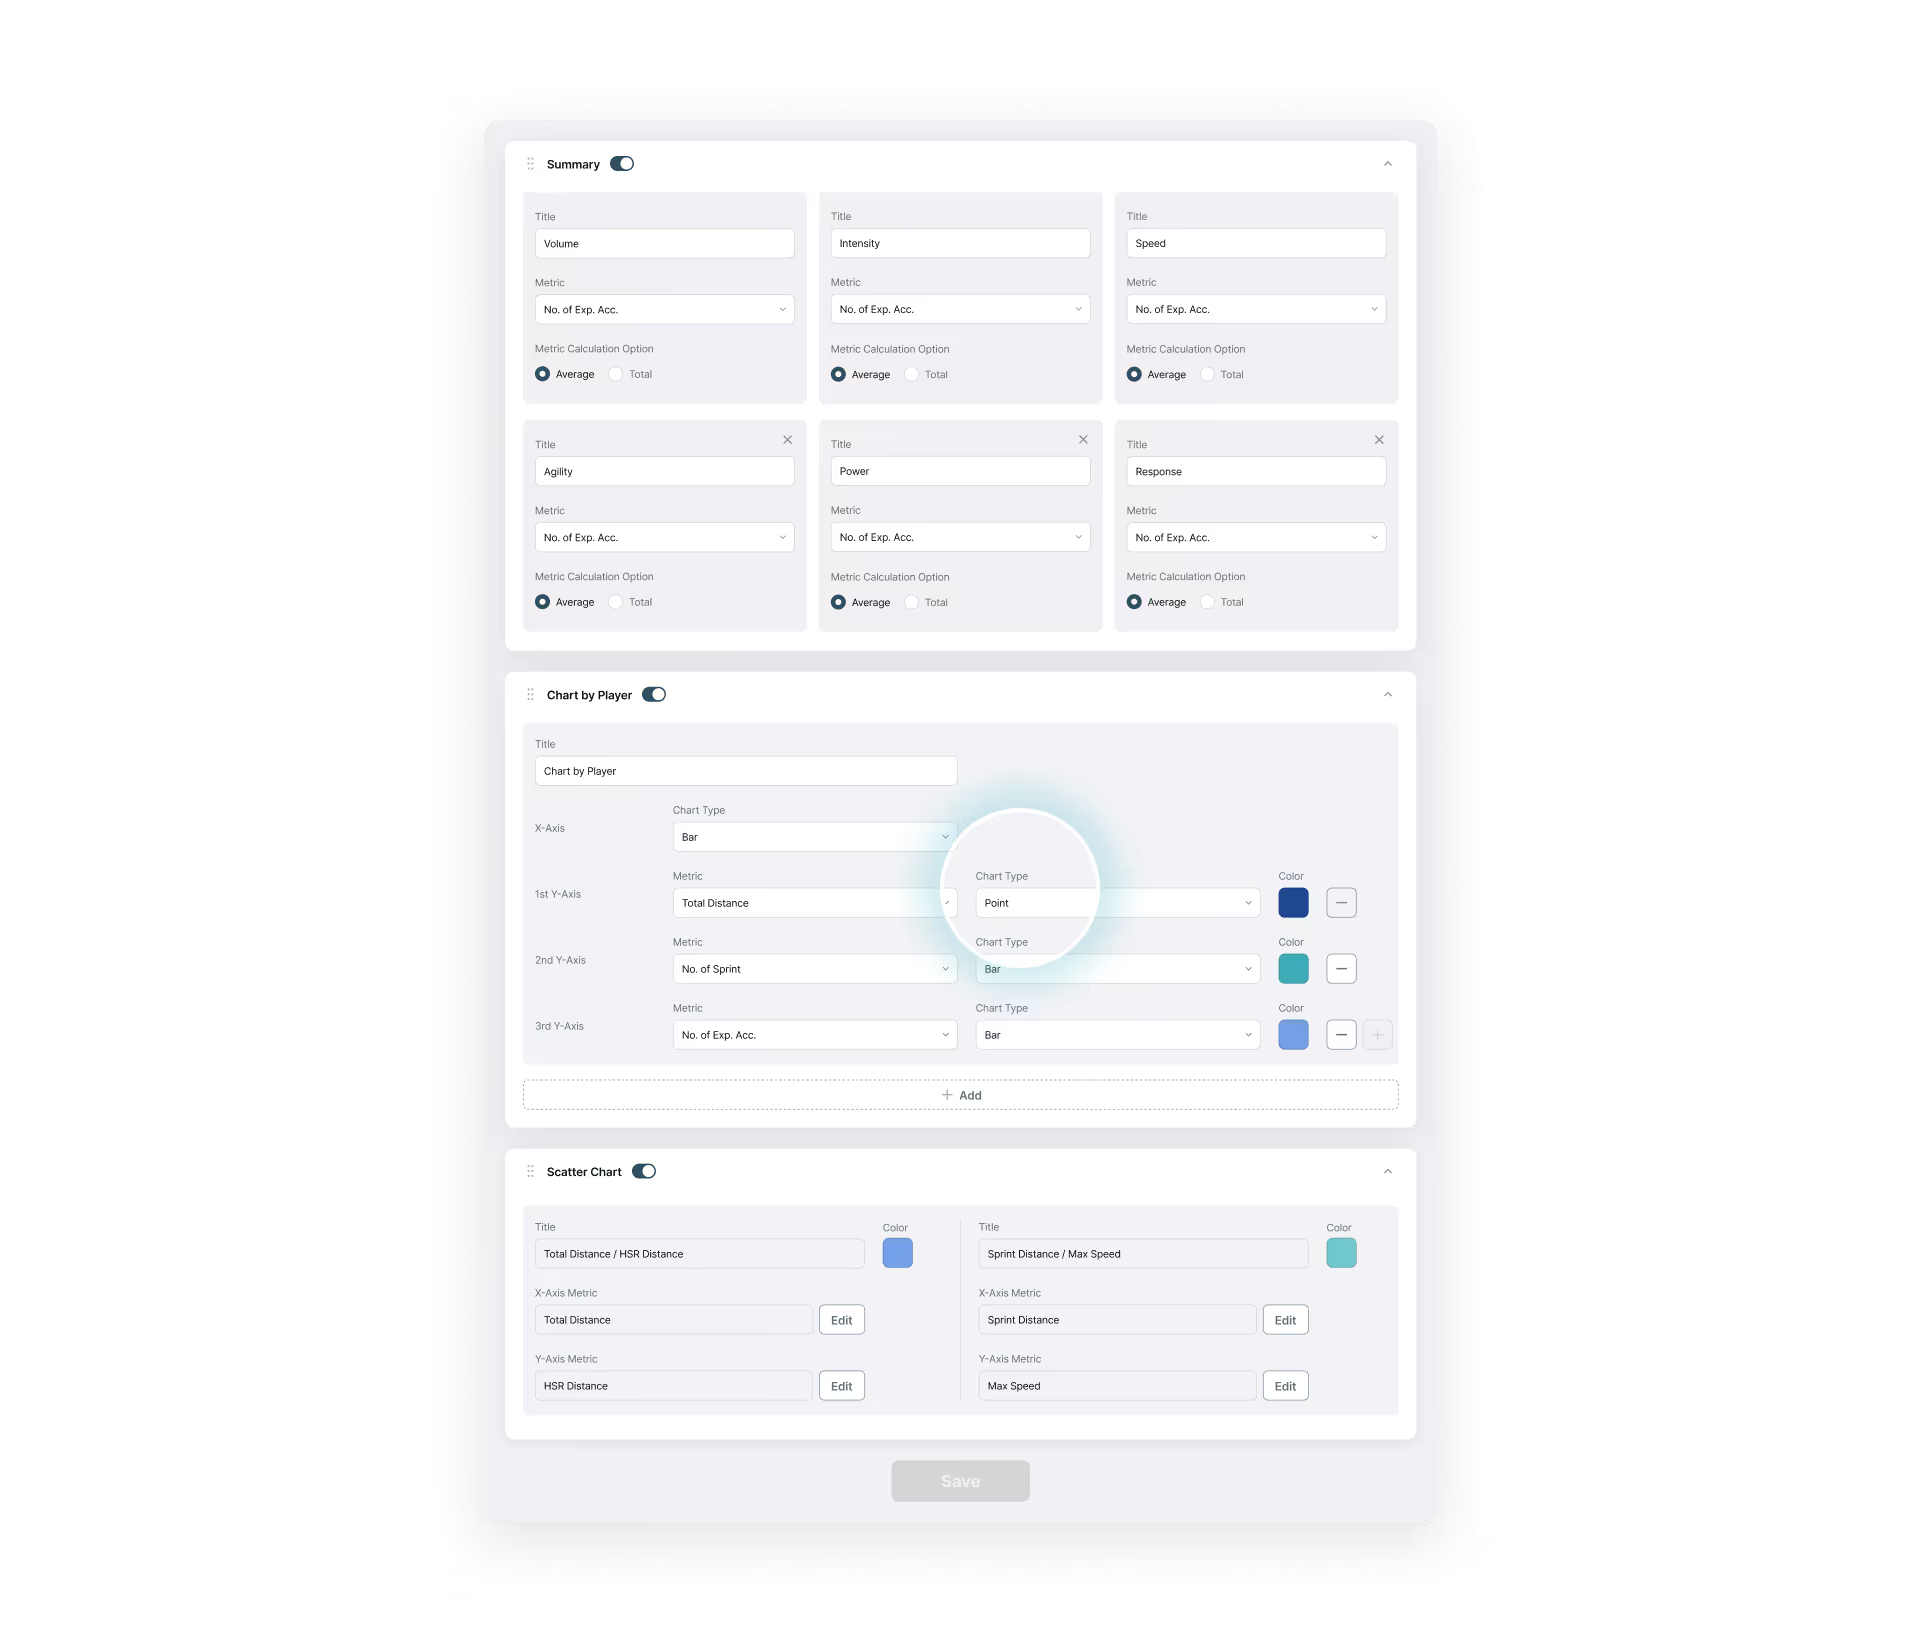
Design and Customize Reports for Any Goal
- Chart & Metric Setup: Choose key metrics and visual formats
- Layout Customization: Adjust positions, and flow
- Saved Templates: Reuse predefined settings anytime
Transition Management
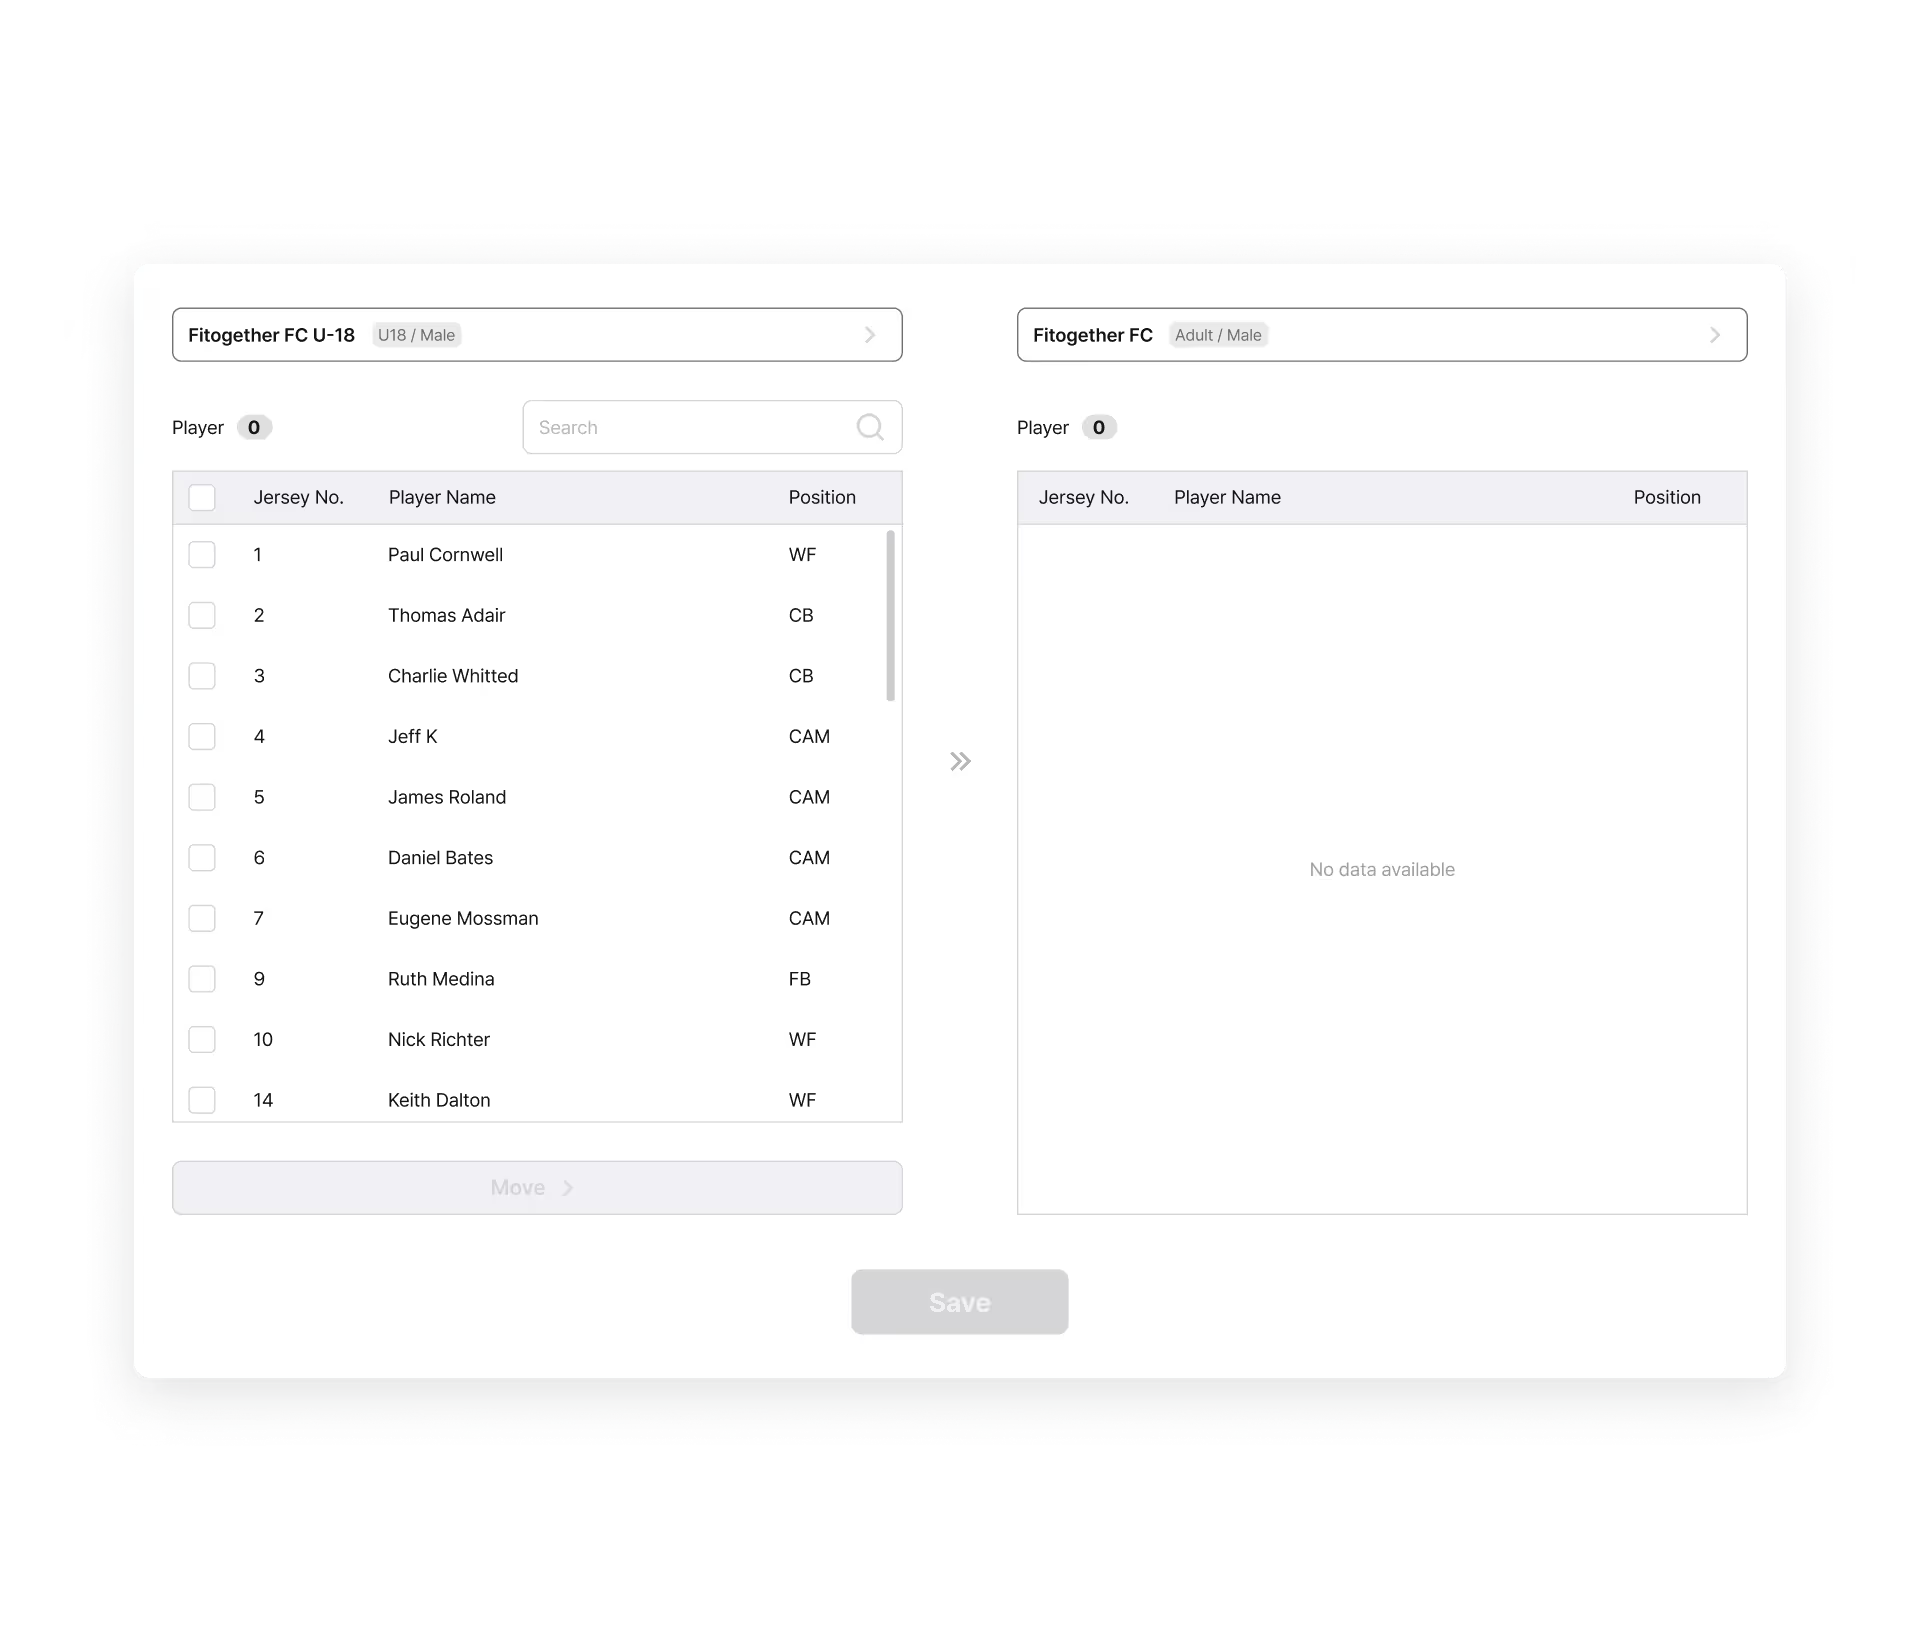
Efficient Player Data Transfer & Integration
- Data Transition: Player profile & device transfer with previous team data access
- Automatic Transfer & Carryover: Max. Speed and HR values
Sharing & Access
Simple & Secure Data Sharing and Access Control
- PDF & CSV Export: Easily convert and share data reports in PDF or CSV format
- API Integration: Seamlessly link existing dashboards and data ecosystems via API
- Access Control: Account-based permissions for data security and user-specific access
Localization & Accessibility
Multi-Language, Unit Conversion, and Responsive UI
- Multi-Language Support: Korean, English, Japanese, Chinese, Spanish, and Portuguese
- Unit Customization: Supports metric (m, km) and imperial (mi, yd, ft) units
- Responsive UI: Optimized for PCs, iPads, and more